
Advertisement
- Hong Kong
- /
- Specialty Stores
- /
- SEHK:8418
Some Optima Automobile Group Holdings Limited (HKG:8418) Shareholders Look For Exit As Shares Take 29% Pounding
Optima Automobile Group Holdings Limited (HKG:8418) shareholders won't be pleased to see that the share price has had a very rough month, dropping 29% and undoing the prior period's positive performance. Instead of being rewarded, shareholders who have already held through the last twelve months are now sitting on a 49% share price drop.
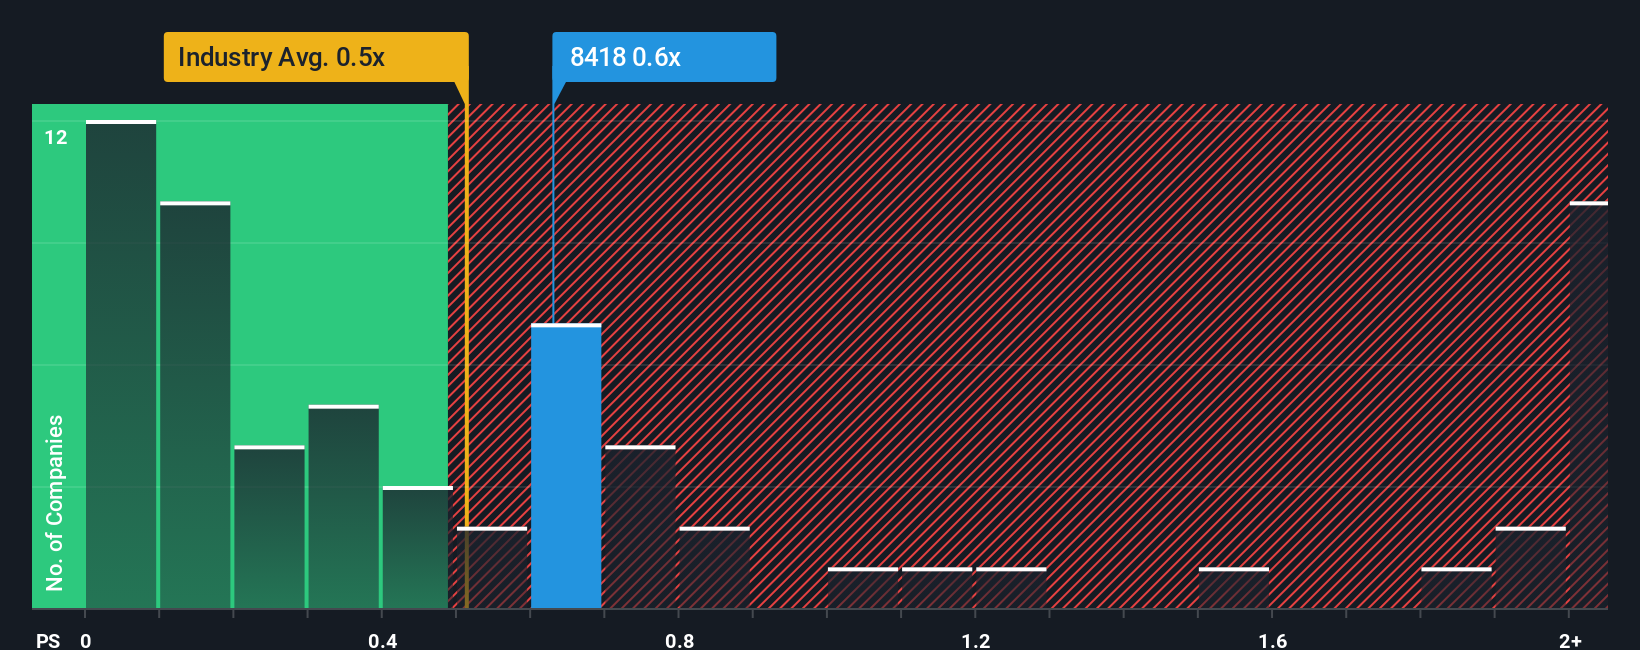
In spite of the heavy fall in price, you could still be forgiven for feeling indifferent about Optima Automobile Group Holdings' P/S ratio of 0.6x, since the median price-to-sales (or "P/S") ratio for the Specialty Retail industry in Hong Kong is also close to 0.5x. While this might not raise any eyebrows, if the P/S ratio is not justified investors could be missing out on a potential opportunity or ignoring looming disappointment.
Check out our latest analysis for Optima Automobile Group Holdings
How Has Optima Automobile Group Holdings Performed Recently?
For example, consider that Optima Automobile Group Holdings' financial performance has been poor lately as its revenue has been in decline. Perhaps investors believe the recent revenue performance is enough to keep in line with the industry, which is keeping the P/S from dropping off. If not, then existing shareholders may be a little nervous about the viability of the share price.
Want the full picture on earnings, revenue and cash flow for the company? Then our free report on Optima Automobile Group Holdings will help you shine a light on its historical performance.How Is Optima Automobile Group Holdings' Revenue Growth Trending?
There's an inherent assumption that a company should be matching the industry for P/S ratios like Optima Automobile Group Holdings' to be considered reasonable.
Retrospectively, the last year delivered a frustrating 16% decrease to the company's top line. However, a few very strong years before that means that it was still able to grow revenue by an impressive 56% in total over the last three years. So we can start by confirming that the company has generally done a very good job of growing revenue over that time, even though it had some hiccups along the way.
Comparing the recent medium-term revenue trends against the industry's one-year growth forecast of 43% shows it's noticeably less attractive.
With this in mind, we find it intriguing that Optima Automobile Group Holdings' P/S is comparable to that of its industry peers. Apparently many investors in the company are less bearish than recent times would indicate and aren't willing to let go of their stock right now. They may be setting themselves up for future disappointment if the P/S falls to levels more in line with recent growth rates.
The Key Takeaway
With its share price dropping off a cliff, the P/S for Optima Automobile Group Holdings looks to be in line with the rest of the Specialty Retail industry. Generally, our preference is to limit the use of the price-to-sales ratio to establishing what the market thinks about the overall health of a company.
Our examination of Optima Automobile Group Holdings revealed its poor three-year revenue trends aren't resulting in a lower P/S as per our expectations, given they look worse than current industry outlook. When we see weak revenue with slower than industry growth, we suspect the share price is at risk of declining, bringing the P/S back in line with expectations. Unless there is a significant improvement in the company's medium-term performance, it will be difficult to prevent the P/S ratio from declining to a more reasonable level.
Don't forget that there may be other risks. For instance, we've identified 2 warning signs for Optima Automobile Group Holdings (1 is a bit unpleasant) you should be aware of.
It's important to make sure you look for a great company, not just the first idea you come across. So if growing profitability aligns with your idea of a great company, take a peek at this free list of interesting companies with strong recent earnings growth (and a low P/E).
New: AI Stock Screener & Alerts
Our new AI Stock Screener scans the market every day to uncover opportunities.
• Dividend Powerhouses (3%+ Yield)
• Undervalued Small Caps with Insider Buying
• High growth Tech and AI Companies
Or build your own from over 50 metrics.
Have feedback on this article? Concerned about the content? Get in touch with us directly. Alternatively, email editorial-team (at) simplywallst.com.
This article by Simply Wall St is general in nature. We provide commentary based on historical data and analyst forecasts only using an unbiased methodology and our articles are not intended to be financial advice. It does not constitute a recommendation to buy or sell any stock, and does not take account of your objectives, or your financial situation. We aim to bring you long-term focused analysis driven by fundamental data. Note that our analysis may not factor in the latest price-sensitive company announcements or qualitative material. Simply Wall St has no position in any stocks mentioned.
About SEHK:8418
Optima Automobile Group Holdings
An investment holding company, provides after-market automotive services in Singapore and the People’s Republic of China.
Excellent balance sheet with very low risk.
Market Insights

Advertisement
Community Narratives
MINISO's fair value is projected at 26.69 with an anticipated PE ratio shift of 20x
Fair Value US$24.03|11.0% undervalued
BE
Community Contributor
Procter & Gamble: A Dividend Giant Facing Slowing Growth
Fair Value US$119.81|23.3% overvalued
AN
Community Contributor
Eli Lilly's Future Growth Driven by Tirzepatide and Favorable Market Conditions
Fair Value US$1.19k|13.8% undervalued
EA
Community Contributor