- Hong Kong
- /
- Retail Distributors
- /
- SEHK:8179
Slammed 34% Palinda Group Holdings Limited (HKG:8179) Screens Well Here But There Might Be A Catch

The Palinda Group Holdings Limited (HKG:8179) share price has fared very poorly over the last month, falling by a substantial 34%. Still, a bad month hasn't completely ruined the past year with the stock gaining 48%, which is great even in a bull market.
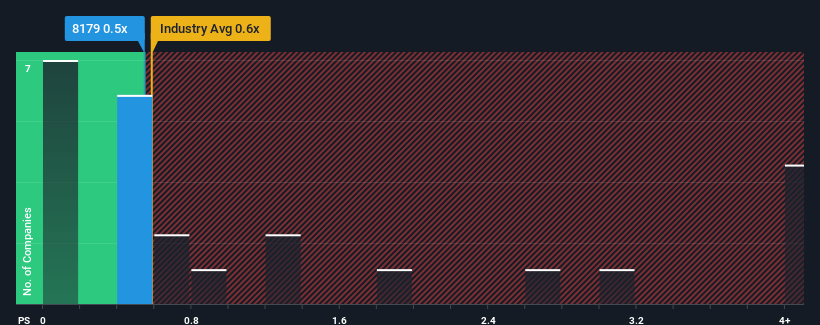
Although its price has dipped substantially, it's still not a stretch to say that Palinda Group Holdings' price-to-sales (or "P/S") ratio of 0.5x right now seems quite "middle-of-the-road" compared to the Retail Distributors industry in Hong Kong, where the median P/S ratio is around 0.6x. However, investors might be overlooking a clear opportunity or potential setback if there is no rational basis for the P/S.
See our latest analysis for Palinda Group Holdings

How Has Palinda Group Holdings Performed Recently?
As an illustration, revenue has deteriorated at Palinda Group Holdings over the last year, which is not ideal at all. Perhaps investors believe the recent revenue performance is enough to keep in line with the industry, which is keeping the P/S from dropping off. If not, then existing shareholders may be a little nervous about the viability of the share price.
Want the full picture on earnings, revenue and cash flow for the company? Then our free report on Palinda Group Holdings will help you shine a light on its historical performance.Is There Some Revenue Growth Forecasted For Palinda Group Holdings?
In order to justify its P/S ratio, Palinda Group Holdings would need to produce growth that's similar to the industry.
Retrospectively, the last year delivered a frustrating 21% decrease to the company's top line. Still, the latest three year period has seen an excellent 108% overall rise in revenue, in spite of its unsatisfying short-term performance. Accordingly, while they would have preferred to keep the run going, shareholders would definitely welcome the medium-term rates of revenue growth.
This is in contrast to the rest of the industry, which is expected to grow by 22% over the next year, materially lower than the company's recent medium-term annualised growth rates.
With this information, we find it interesting that Palinda Group Holdings is trading at a fairly similar P/S compared to the industry. It may be that most investors are not convinced the company can maintain its recent growth rates.
What Does Palinda Group Holdings' P/S Mean For Investors?
With its share price dropping off a cliff, the P/S for Palinda Group Holdings looks to be in line with the rest of the Retail Distributors industry. We'd say the price-to-sales ratio's power isn't primarily as a valuation instrument but rather to gauge current investor sentiment and future expectations.
We've established that Palinda Group Holdings currently trades on a lower than expected P/S since its recent three-year growth is higher than the wider industry forecast. There could be some unobserved threats to revenue preventing the P/S ratio from matching this positive performance. At least the risk of a price drop looks to be subdued if recent medium-term revenue trends continue, but investors seem to think future revenue could see some volatility.
You should always think about risks. Case in point, we've spotted 2 warning signs for Palinda Group Holdings you should be aware of, and 1 of them doesn't sit too well with us.
If strong companies turning a profit tickle your fancy, then you'll want to check out this free list of interesting companies that trade on a low P/E (but have proven they can grow earnings).
New: Manage All Your Stock Portfolios in One Place
We've created the ultimate portfolio companion for stock investors, and it's free.
• Connect an unlimited number of Portfolios and see your total in one currency
• Be alerted to new Warning Signs or Risks via email or mobile
• Track the Fair Value of your stocks
Have feedback on this article? Concerned about the content? Get in touch with us directly. Alternatively, email editorial-team (at) simplywallst.com.
This article by Simply Wall St is general in nature. We provide commentary based on historical data and analyst forecasts only using an unbiased methodology and our articles are not intended to be financial advice. It does not constitute a recommendation to buy or sell any stock, and does not take account of your objectives, or your financial situation. We aim to bring you long-term focused analysis driven by fundamental data. Note that our analysis may not factor in the latest price-sensitive company announcements or qualitative material. Simply Wall St has no position in any stocks mentioned.
About SEHK:8179
Palinda Group Holdings
An investment holding company, engages in the sale and distribution of wine products and ancillary wine-related products in Hong Kong, the British Virgin Islands, and Australia.
Slight with mediocre balance sheet.
Market Insights
Community Narratives


