
Advertisement
Investors Will Want Parkson Retail Group's (HKG:3368) Growth In ROCE To Persist

To find a multi-bagger stock, what are the underlying trends we should look for in a business? Firstly, we'll want to see a proven return on capital employed (ROCE) that is increasing, and secondly, an expanding base of capital employed. This shows us that it's a compounding machine, able to continually reinvest its earnings back into the business and generate higher returns. Speaking of which, we noticed some great changes in Parkson Retail Group's (HKG:3368) returns on capital, so let's have a look.
Understanding Return On Capital Employed (ROCE)
For those that aren't sure what ROCE is, it measures the amount of pre-tax profits a company can generate from the capital employed in its business. To calculate this metric for Parkson Retail Group, this is the formula:
Return on Capital Employed = Earnings Before Interest and Tax (EBIT) ÷ (Total Assets - Current Liabilities)
0.025 = CN¥261m ÷ (CN¥14b - CN¥4.0b) (Based on the trailing twelve months to December 2020).
Therefore, Parkson Retail Group has an ROCE of 2.5%. In absolute terms, that's a low return and it also under-performs the Multiline Retail industry average of 7.2%.
See our latest analysis for Parkson Retail Group
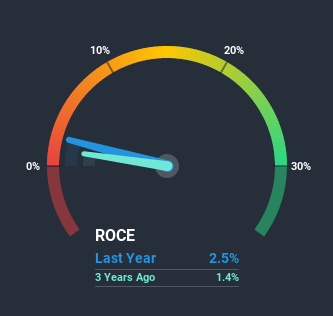
Historical performance is a great place to start when researching a stock so above you can see the gauge for Parkson Retail Group's ROCE against it's prior returns. If you'd like to look at how Parkson Retail Group has performed in the past in other metrics, you can view this free graph of past earnings, revenue and cash flow.
What Can We Tell From Parkson Retail Group's ROCE Trend?
While the ROCE isn't as high as some other companies out there, it's great to see it's on the up. Looking at the data, we can see that even though capital employed in the business has remained relatively flat, the ROCE generated has risen by 424% over the last five years. So it's likely that the business is now reaping the full benefits of its past investments, since the capital employed hasn't changed considerably. It's worth looking deeper into this though because while it's great that the business is more efficient, it might also mean that going forward the areas to invest internally for the organic growth are lacking.
What We Can Learn From Parkson Retail Group's ROCE
As discussed above, Parkson Retail Group appears to be getting more proficient at generating returns since capital employed has remained flat but earnings (before interest and tax) are up. Given the stock has declined 62% in the last five years, this could be a good investment if the valuation and other metrics are also appealing. So researching this company further and determining whether or not these trends will continue seems justified.
If you want to know some of the risks facing Parkson Retail Group we've found 3 warning signs (1 is a bit unpleasant!) that you should be aware of before investing here.
While Parkson Retail Group isn't earning the highest return, check out this free list of companies that are earning high returns on equity with solid balance sheets.
If you’re looking to trade Parkson Retail Group, open an account with the lowest-cost* platform trusted by professionals, Interactive Brokers. Their clients from over 200 countries and territories trade stocks, options, futures, forex, bonds and funds worldwide from a single integrated account. Promoted
New: Manage All Your Stock Portfolios in One Place
We've created the ultimate portfolio companion for stock investors, and it's free.
• Connect an unlimited number of Portfolios and see your total in one currency
• Be alerted to new Warning Signs or Risks via email or mobile
• Track the Fair Value of your stocks
This article by Simply Wall St is general in nature. It does not constitute a recommendation to buy or sell any stock, and does not take account of your objectives, or your financial situation. We aim to bring you long-term focused analysis driven by fundamental data. Note that our analysis may not factor in the latest price-sensitive company announcements or qualitative material. Simply Wall St has no position in any stocks mentioned.
*Interactive Brokers Rated Lowest Cost Broker by StockBrokers.com Annual Online Review 2020
Have feedback on this article? Concerned about the content? Get in touch with us directly. Alternatively, email editorial-team (at) simplywallst.com.
About SEHK:3368
Parkson Retail Group
Operates and manages a network of department stores, shopping malls, outlets, and supermarkets in the People’s Republic of China.
Good value with adequate balance sheet.
Similar Companies
Market Insights

Advertisement
Community Narratives
Groundbreaking therapies that could change the treatment landscape for PTSD, fibromyalgia, MS & Alzheimer’s
Fair Value US$6.20|86.9% undervalued
CM
Community Contributor
DigitalOcean Will Grow 14% by Embracing AI with Paperspace Acquisition
Fair Value US$50.00|42.8% undervalued
NE
Community Contributor
Viant Technology: A Rising AdTech Challenger in the AI-Powered CTV Market
Fair Value US$38.61|66.0% undervalued
BL
Community Contributor
Volvo will Accelerate Forward into Electric and Autonomous Leadership in Five Years
Fair Value SEK 438.80|40.1% undervalued
UN
Community Contributor