
Advertisement
- Hong Kong
- /
- Specialty Stores
- /
- SEHK:1268
There's Reason For Concern Over China MeiDong Auto Holdings Limited's (HKG:1268) Massive 27% Price Jump
China MeiDong Auto Holdings Limited (HKG:1268) shareholders are no doubt pleased to see that the share price has bounced 27% in the last month, although it is still struggling to make up recently lost ground. Still, the 30-day jump doesn't change the fact that longer term shareholders have seen their stock decimated by the 81% share price drop in the last twelve months.
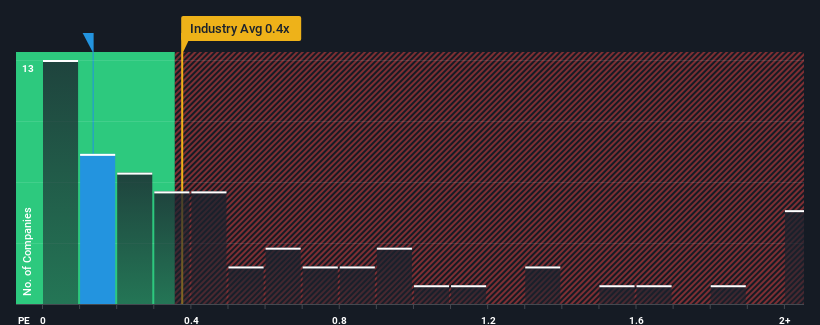
Even after such a large jump in price, it's still not a stretch to say that China MeiDong Auto Holdings' price-to-sales (or "P/S") ratio of 0.1x right now seems quite "middle-of-the-road" compared to the Specialty Retail industry in Hong Kong, where the median P/S ratio is around 0.4x. Although, it's not wise to simply ignore the P/S without explanation as investors may be disregarding a distinct opportunity or a costly mistake.
Check out our latest analysis for China MeiDong Auto Holdings
How Has China MeiDong Auto Holdings Performed Recently?
With revenue growth that's superior to most other companies of late, China MeiDong Auto Holdings has been doing relatively well. It might be that many expect the strong revenue performance to wane, which has kept the P/S ratio from rising. If the company manages to stay the course, then investors should be rewarded with a share price that matches its revenue figures.
Want the full picture on analyst estimates for the company? Then our free report on China MeiDong Auto Holdings will help you uncover what's on the horizon.What Are Revenue Growth Metrics Telling Us About The P/S?
In order to justify its P/S ratio, China MeiDong Auto Holdings would need to produce growth that's similar to the industry.
Retrospectively, the last year delivered an exceptional 23% gain to the company's top line. The strong recent performance means it was also able to grow revenue by 69% in total over the last three years. Accordingly, shareholders would have definitely welcomed those medium-term rates of revenue growth.
Shifting to the future, estimates from the twelve analysts covering the company suggest revenue growth is heading into negative territory, declining 2.9% over the next year. With the industry predicted to deliver 16% growth, that's a disappointing outcome.
With this in consideration, we think it doesn't make sense that China MeiDong Auto Holdings' P/S is closely matching its industry peers. It seems most investors are hoping for a turnaround in the company's business prospects, but the analyst cohort is not so confident this will happen. Only the boldest would assume these prices are sustainable as these declining revenues are likely to weigh on the share price eventually.
What Does China MeiDong Auto Holdings' P/S Mean For Investors?
Its shares have lifted substantially and now China MeiDong Auto Holdings' P/S is back within range of the industry median. We'd say the price-to-sales ratio's power isn't primarily as a valuation instrument but rather to gauge current investor sentiment and future expectations.
It appears that China MeiDong Auto Holdings currently trades on a higher than expected P/S for a company whose revenues are forecast to decline. With this in mind, we don't feel the current P/S is justified as declining revenues are unlikely to support a more positive sentiment for long. If we consider the revenue outlook, the P/S seems to indicate that potential investors may be paying a premium for the stock.
Having said that, be aware China MeiDong Auto Holdings is showing 3 warning signs in our investment analysis, you should know about.
If these risks are making you reconsider your opinion on China MeiDong Auto Holdings, explore our interactive list of high quality stocks to get an idea of what else is out there.
New: AI Stock Screener & Alerts
Our new AI Stock Screener scans the market every day to uncover opportunities.
• Dividend Powerhouses (3%+ Yield)
• Undervalued Small Caps with Insider Buying
• High growth Tech and AI Companies
Or build your own from over 50 metrics.
Have feedback on this article? Concerned about the content? Get in touch with us directly. Alternatively, email editorial-team (at) simplywallst.com.
This article by Simply Wall St is general in nature. We provide commentary based on historical data and analyst forecasts only using an unbiased methodology and our articles are not intended to be financial advice. It does not constitute a recommendation to buy or sell any stock, and does not take account of your objectives, or your financial situation. We aim to bring you long-term focused analysis driven by fundamental data. Note that our analysis may not factor in the latest price-sensitive company announcements or qualitative material. Simply Wall St has no position in any stocks mentioned.
About SEHK:1268
China MeiDong Auto Holdings
An investment holding company, operates as an automobile dealer in the People’s Republic of China.
Good value with adequate balance sheet.
Market Insights

Advertisement
Community Narratives
Kodiak AI - a potential 100 bagger opportunity?
Fair Value US$14.00|44.7% undervalued
DA
Community Contributor
A Fair Price for a Great Business Facing Real Threats
Fair Value US$383.06|13.0% undervalued
IM
Community Contributor
AXON And Shopify Integration Will Unlock Global Mobile Advertising
Fair Value US$646.30|0% overvalued
AN
Based on Analyst Price Targets