- Hong Kong
- /
- Specialty Stores
- /
- SEHK:104
What Can The Trends At Asia Commercial Holdings (HKG:104) Tell Us About Their Returns?


There are a few key trends to look for if we want to identify the next multi-bagger. Firstly, we'd want to identify a growing return on capital employed (ROCE) and then alongside that, an ever-increasing base of capital employed. Basically this means that a company has profitable initiatives that it can continue to reinvest in, which is a trait of a compounding machine. Speaking of which, we noticed some great changes in Asia Commercial Holdings' (HKG:104) returns on capital, so let's have a look.
Understanding Return On Capital Employed (ROCE)
Just to clarify if you're unsure, ROCE is a metric for evaluating how much pre-tax income (in percentage terms) a company earns on the capital invested in its business. Analysts use this formula to calculate it for Asia Commercial Holdings:
Return on Capital Employed = Earnings Before Interest and Tax (EBIT) ÷ (Total Assets - Current Liabilities)
0.025 = HK$11m ÷ (HK$825m - HK$361m) (Based on the trailing twelve months to September 2020).
Thus, Asia Commercial Holdings has an ROCE of 2.5%. Ultimately, that's a low return and it under-performs the Specialty Retail industry average of 11%.
Check out our latest analysis for Asia Commercial Holdings
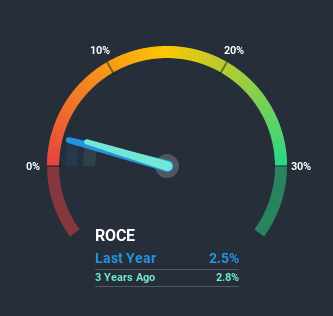
Historical performance is a great place to start when researching a stock so above you can see the gauge for Asia Commercial Holdings' ROCE against it's prior returns. If you'd like to look at how Asia Commercial Holdings has performed in the past in other metrics, you can view this free graph of past earnings, revenue and cash flow.
So How Is Asia Commercial Holdings' ROCE Trending?
We're delighted to see that Asia Commercial Holdings is reaping rewards from its investments and has now broken into profitability. The company now earns 2.5% on its capital, because five years ago it was incurring losses. On top of that, what's interesting is that the amount of capital being employed has remained steady, so the business hasn't needed to put any additional money to work to generate these higher returns. That being said, while an increase in efficiency is no doubt appealing, it'd be helpful to know if the company does have any investment plans going forward. Because in the end, a business can only get so efficient.
On a separate but related note, it's important to know that Asia Commercial Holdings has a current liabilities to total assets ratio of 44%, which we'd consider pretty high. This effectively means that suppliers (or short-term creditors) are funding a large portion of the business, so just be aware that this can introduce some elements of risk. While it's not necessarily a bad thing, it can be beneficial if this ratio is lower.What We Can Learn From Asia Commercial Holdings' ROCE
To sum it up, Asia Commercial Holdings is collecting higher returns from the same amount of capital, and that's impressive. Given the stock has declined 36% in the last five years, this could be a good investment if the valuation and other metrics are also appealing. That being the case, research into the company's current valuation metrics and future prospects seems fitting.
One more thing: We've identified 2 warning signs with Asia Commercial Holdings (at least 1 which is concerning) , and understanding them would certainly be useful.
If you want to search for solid companies with great earnings, check out this free list of companies with good balance sheets and impressive returns on equity.
If you’re looking to trade Asia Commercial Holdings, open an account with the lowest-cost* platform trusted by professionals, Interactive Brokers. Their clients from over 200 countries and territories trade stocks, options, futures, forex, bonds and funds worldwide from a single integrated account. Promoted
If you're looking to trade Asia Commercial Holdings, open an account with the lowest-cost platform trusted by professionals, Interactive Brokers.
With clients in over 200 countries and territories, and access to 160 markets, IBKR lets you trade stocks, options, futures, forex, bonds and funds from a single integrated account.
Enjoy no hidden fees, no account minimums, and FX conversion rates as low as 0.03%, far better than what most brokers offer.
Sponsored ContentNew: Manage All Your Stock Portfolios in One Place
We've created the ultimate portfolio companion for stock investors, and it's free.
• Connect an unlimited number of Portfolios and see your total in one currency
• Be alerted to new Warning Signs or Risks via email or mobile
• Track the Fair Value of your stocks
This article by Simply Wall St is general in nature. It does not constitute a recommendation to buy or sell any stock, and does not take account of your objectives, or your financial situation. We aim to bring you long-term focused analysis driven by fundamental data. Note that our analysis may not factor in the latest price-sensitive company announcements or qualitative material. Simply Wall St has no position in any stocks mentioned.
*Interactive Brokers Rated Lowest Cost Broker by StockBrokers.com Annual Online Review 2020
Have feedback on this article? Concerned about the content? Get in touch with us directly. Alternatively, email editorial-team@simplywallst.com.
About SEHK:104
Asia Commercial Holdings
An investment holding company, engages in the trading and sale of watches in Hong Kong, the People’s Republic of China, the United Kingdom, and Switzerland.
Flawless balance sheet, good value and pays a dividend.
Market Insights

Community Narratives

