Yuexiu Real Estate Investment Trust (HKG:405) earnings and shareholder returns have been trending downwards for the last five years, but the stock rises 7.0% this past week

Statistically speaking, long term investing is a profitable endeavour. But unfortunately, some companies simply don't succeed. Zooming in on an example, the Yuexiu Real Estate Investment Trust (HKG:405) share price dropped 76% in the last half decade. We certainly feel for shareholders who bought near the top. And it's not just long term holders hurting, because the stock is down 37% in the last year. But it's up 7.0% in the last week.
On a more encouraging note the company has added HK$391m to its market cap in just the last 7 days, so let's see if we can determine what's driven the five-year loss for shareholders.
Check out our latest analysis for Yuexiu Real Estate Investment Trust
To paraphrase Benjamin Graham: Over the short term the market is a voting machine, but over the long term it's a weighing machine. One way to examine how market sentiment has changed over time is to look at the interaction between a company's share price and its earnings per share (EPS).
Yuexiu Real Estate Investment Trust became profitable within the last five years. That would generally be considered a positive, so we are surprised to see the share price is down. Other metrics might give us a better handle on how its value is changing over time.
The most recent dividend was actually lower than it was in the past, so that may have sent the share price lower. The revenue decline of around 1.7% would not have helped the stock price. So the the weak dividend and revenue data could well help explain the soft share price.
You can see below how earnings and revenue have changed over time (discover the exact values by clicking on the image).
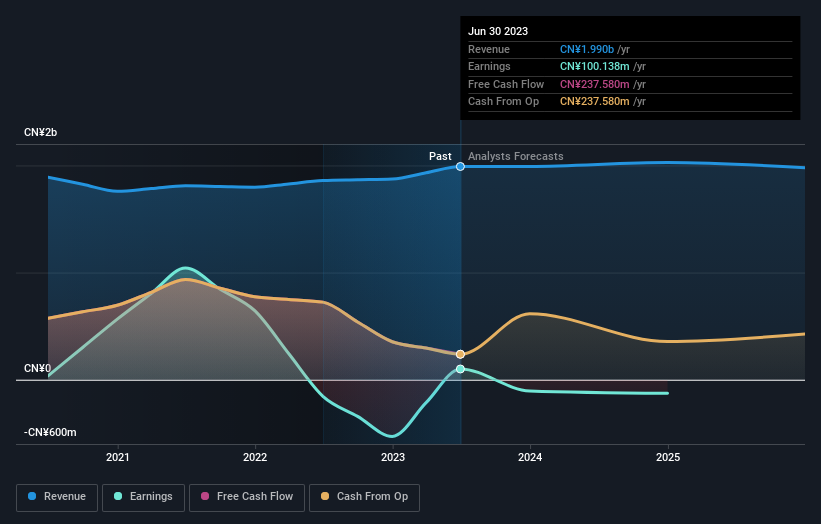
We know that Yuexiu Real Estate Investment Trust has improved its bottom line lately, but what does the future have in store? This free report showing analyst forecasts should help you form a view on Yuexiu Real Estate Investment Trust
What About Dividends?
When looking at investment returns, it is important to consider the difference between total shareholder return (TSR) and share price return. Whereas the share price return only reflects the change in the share price, the TSR includes the value of dividends (assuming they were reinvested) and the benefit of any discounted capital raising or spin-off. It's fair to say that the TSR gives a more complete picture for stocks that pay a dividend. In the case of Yuexiu Real Estate Investment Trust, it has a TSR of -66% for the last 5 years. That exceeds its share price return that we previously mentioned. And there's no prize for guessing that the dividend payments largely explain the divergence!
A Different Perspective
We regret to report that Yuexiu Real Estate Investment Trust shareholders are down 33% for the year (even including dividends). Unfortunately, that's worse than the broader market decline of 7.8%. Having said that, it's inevitable that some stocks will be oversold in a falling market. The key is to keep your eyes on the fundamental developments. Unfortunately, last year's performance may indicate unresolved challenges, given that it was worse than the annualised loss of 11% over the last half decade. Generally speaking long term share price weakness can be a bad sign, though contrarian investors might want to research the stock in hope of a turnaround. I find it very interesting to look at share price over the long term as a proxy for business performance. But to truly gain insight, we need to consider other information, too. For instance, we've identified 5 warning signs for Yuexiu Real Estate Investment Trust (3 are potentially serious) that you should be aware of.
If you like to buy stocks alongside management, then you might just love this free list of companies. (Hint: insiders have been buying them).
Please note, the market returns quoted in this article reflect the market weighted average returns of stocks that currently trade on Hong Kong exchanges.
New: Manage All Your Stock Portfolios in One Place
We've created the ultimate portfolio companion for stock investors, and it's free.
• Connect an unlimited number of Portfolios and see your total in one currency
• Be alerted to new Warning Signs or Risks via email or mobile
• Track the Fair Value of your stocks
Have feedback on this article? Concerned about the content? Get in touch with us directly. Alternatively, email editorial-team (at) simplywallst.com.
This article by Simply Wall St is general in nature. We provide commentary based on historical data and analyst forecasts only using an unbiased methodology and our articles are not intended to be financial advice. It does not constitute a recommendation to buy or sell any stock, and does not take account of your objectives, or your financial situation. We aim to bring you long-term focused analysis driven by fundamental data. Note that our analysis may not factor in the latest price-sensitive company announcements or qualitative material. Simply Wall St has no position in any stocks mentioned.
About SEHK:405
Yuexiu Real Estate Investment Trust
Yuexiu Real Estate Investment Trust (“Yuexiu REIT”) and its subsidiaries (together, the “Group”) are mainly engaged in the leasing of commercial properties in the People’s Republic of China (the “PRC”).
Fair value unattractive dividend payer.
Market Insights

Community Narratives


