
Advertisement

Howard Marks put it nicely when he said that, rather than worrying about share price volatility, 'The possibility of permanent loss is the risk I worry about... and every practical investor I know worries about.' So it seems the smart money knows that debt - which is usually involved in bankruptcies - is a very important factor, when you assess how risky a company is. We can see that Y. T. Realty Group Limited (HKG:75) does use debt in its business. But is this debt a concern to shareholders?
Why Does Debt Bring Risk?
Debt assists a business until the business has trouble paying it off, either with new capital or with free cash flow. Part and parcel of capitalism is the process of 'creative destruction' where failed businesses are mercilessly liquidated by their bankers. While that is not too common, we often do see indebted companies permanently diluting shareholders because lenders force them to raise capital at a distressed price. Of course, plenty of companies use debt to fund growth, without any negative consequences. The first step when considering a company's debt levels is to consider its cash and debt together.
View our latest analysis for Y. T. Realty Group
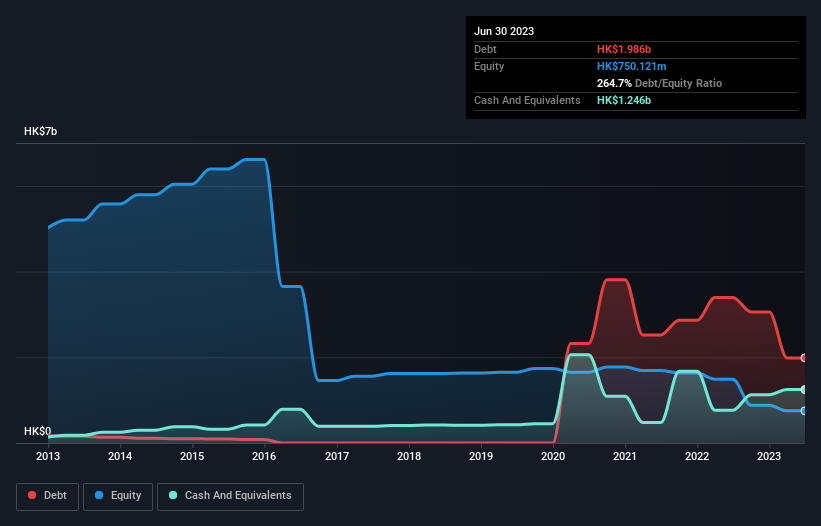
How Much Debt Does Y. T. Realty Group Carry?
You can click the graphic below for the historical numbers, but it shows that Y. T. Realty Group had HK$1.99b of debt in June 2023, down from HK$3.40b, one year before. On the flip side, it has HK$1.25b in cash leading to net debt of about HK$739.8m.
A Look At Y. T. Realty Group's Liabilities
According to the last reported balance sheet, Y. T. Realty Group had liabilities of HK$16.7b due within 12 months, and liabilities of HK$1.44b due beyond 12 months. Offsetting this, it had HK$1.25b in cash and HK$2.05b in receivables that were due within 12 months. So its liabilities total HK$14.9b more than the combination of its cash and short-term receivables.
This deficit casts a shadow over the HK$295.8m company, like a colossus towering over mere mortals. So we definitely think shareholders need to watch this one closely. After all, Y. T. Realty Group would likely require a major re-capitalisation if it had to pay its creditors today.
We measure a company's debt load relative to its earnings power by looking at its net debt divided by its earnings before interest, tax, depreciation, and amortization (EBITDA) and by calculating how easily its earnings before interest and tax (EBIT) cover its interest expense (interest cover). Thus we consider debt relative to earnings both with and without depreciation and amortization expenses.
Weak interest cover of 0.17 times and a disturbingly high net debt to EBITDA ratio of 9.6 hit our confidence in Y. T. Realty Group like a one-two punch to the gut. This means we'd consider it to have a heavy debt load. The silver lining is that Y. T. Realty Group grew its EBIT by 227% last year, which nourishing like the idealism of youth. If that earnings trend continues it will make its debt load much more manageable in the future. There's no doubt that we learn most about debt from the balance sheet. But you can't view debt in total isolation; since Y. T. Realty Group will need earnings to service that debt. So if you're keen to discover more about its earnings, it might be worth checking out this graph of its long term earnings trend.
Finally, while the tax-man may adore accounting profits, lenders only accept cold hard cash. So the logical step is to look at the proportion of that EBIT that is matched by actual free cash flow. Over the last two years, Y. T. Realty Group actually produced more free cash flow than EBIT. That sort of strong cash generation warms our hearts like a puppy in a bumblebee suit.
Our View
On the face of it, Y. T. Realty Group's interest cover left us tentative about the stock, and its level of total liabilities was no more enticing than the one empty restaurant on the busiest night of the year. But at least it's pretty decent at converting EBIT to free cash flow; that's encouraging. Looking at the balance sheet and taking into account all these factors, we do believe that debt is making Y. T. Realty Group stock a bit risky. That's not necessarily a bad thing, but we'd generally feel more comfortable with less leverage. When analysing debt levels, the balance sheet is the obvious place to start. But ultimately, every company can contain risks that exist outside of the balance sheet. For example, we've discovered 3 warning signs for Y. T. Realty Group (2 are a bit concerning!) that you should be aware of before investing here.
If you're interested in investing in businesses that can grow profits without the burden of debt, then check out this free list of growing businesses that have net cash on the balance sheet.
New: Manage All Your Stock Portfolios in One Place
We've created the ultimate portfolio companion for stock investors, and it's free.
• Connect an unlimited number of Portfolios and see your total in one currency
• Be alerted to new Warning Signs or Risks via email or mobile
• Track the Fair Value of your stocks
Have feedback on this article? Concerned about the content? Get in touch with us directly. Alternatively, email editorial-team (at) simplywallst.com.
This article by Simply Wall St is general in nature. We provide commentary based on historical data and analyst forecasts only using an unbiased methodology and our articles are not intended to be financial advice. It does not constitute a recommendation to buy or sell any stock, and does not take account of your objectives, or your financial situation. We aim to bring you long-term focused analysis driven by fundamental data. Note that our analysis may not factor in the latest price-sensitive company announcements or qualitative material. Simply Wall St has no position in any stocks mentioned.
About SEHK:75
Y. T. Realty Group
An investment holding company, engages in the property investment, development, and trading activities in Hong Kong, the United Kingdom, and Mainland China.
Low and slightly overvalued.
Market Insights

Advertisement
Community Narratives

BMW cruising ahead with new EVs and premium models to boost revenue 5%
Fair Value €135.07|44.6% undervalued
UN
Community Contributor
EU#2 - From Humble Beginnings to Global Powerhouse
Fair Value DKK 851.04|46.4% undervalued
TO
Community Contributor