
Advertisement
- Hong Kong
- /
- Real Estate
- /
- SEHK:3603
Xinji Shaxi Group Co., Ltd's (HKG:3603) 74% Dip Still Leaving Some Shareholders Feeling Restless Over Its P/SRatio
Xinji Shaxi Group Co., Ltd (HKG:3603) shareholders that were waiting for something to happen have been dealt a blow with a 74% share price drop in the last month. The recent drop completes a disastrous twelve months for shareholders, who are sitting on a 77% loss during that time.
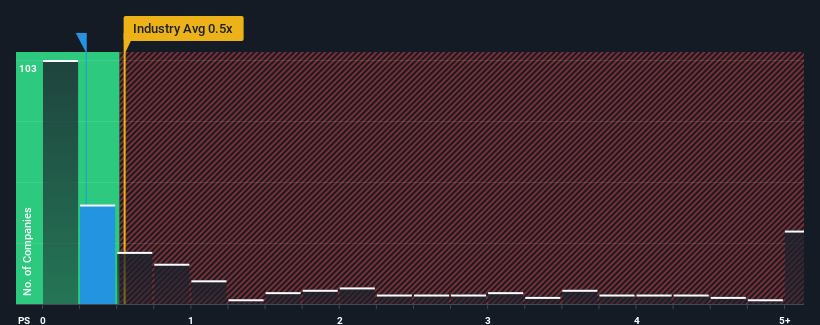
Even after such a large drop in price, it's still not a stretch to say that Xinji Shaxi Group's price-to-sales (or "P/S") ratio of 0.3x right now seems quite "middle-of-the-road" compared to the Real Estate industry in Hong Kong, where the median P/S ratio is around 0.5x. Although, it's not wise to simply ignore the P/S without explanation as investors may be disregarding a distinct opportunity or a costly mistake.
View our latest analysis for Xinji Shaxi Group
How Has Xinji Shaxi Group Performed Recently?
For instance, Xinji Shaxi Group's receding revenue in recent times would have to be some food for thought. It might be that many expect the company to put the disappointing revenue performance behind them over the coming period, which has kept the P/S from falling. If you like the company, you'd at least be hoping this is the case so that you could potentially pick up some stock while it's not quite in favour.
Want the full picture on earnings, revenue and cash flow for the company? Then our free report on Xinji Shaxi Group will help you shine a light on its historical performance.Is There Some Revenue Growth Forecasted For Xinji Shaxi Group?
Xinji Shaxi Group's P/S ratio would be typical for a company that's only expected to deliver moderate growth, and importantly, perform in line with the industry.
Retrospectively, the last year delivered a frustrating 8.4% decrease to the company's top line. The last three years don't look nice either as the company has shrunk revenue by 5.1% in aggregate. Accordingly, shareholders would have felt downbeat about the medium-term rates of revenue growth.
Comparing that to the industry, which is predicted to deliver 4.7% growth in the next 12 months, the company's downward momentum based on recent medium-term revenue results is a sobering picture.
In light of this, it's somewhat alarming that Xinji Shaxi Group's P/S sits in line with the majority of other companies. Apparently many investors in the company are way less bearish than recent times would indicate and aren't willing to let go of their stock right now. There's a good chance existing shareholders are setting themselves up for future disappointment if the P/S falls to levels more in line with the recent negative growth rates.
What Does Xinji Shaxi Group's P/S Mean For Investors?
Xinji Shaxi Group's plummeting stock price has brought its P/S back to a similar region as the rest of the industry. Typically, we'd caution against reading too much into price-to-sales ratios when settling on investment decisions, though it can reveal plenty about what other market participants think about the company.
Our look at Xinji Shaxi Group revealed its shrinking revenues over the medium-term haven't impacted the P/S as much as we anticipated, given the industry is set to grow. Even though it matches the industry, we're uncomfortable with the current P/S ratio, as this dismal revenue performance is unlikely to support a more positive sentiment for long. Unless the recent medium-term conditions improve markedly, investors will have a hard time accepting the share price as fair value.
We don't want to rain on the parade too much, but we did also find 3 warning signs for Xinji Shaxi Group (2 are a bit concerning!) that you need to be mindful of.
If these risks are making you reconsider your opinion on Xinji Shaxi Group, explore our interactive list of high quality stocks to get an idea of what else is out there.
New: AI Stock Screener & Alerts
Our new AI Stock Screener scans the market every day to uncover opportunities.
• Dividend Powerhouses (3%+ Yield)
• Undervalued Small Caps with Insider Buying
• High growth Tech and AI Companies
Or build your own from over 50 metrics.
Have feedback on this article? Concerned about the content? Get in touch with us directly. Alternatively, email editorial-team (at) simplywallst.com.
This article by Simply Wall St is general in nature. We provide commentary based on historical data and analyst forecasts only using an unbiased methodology and our articles are not intended to be financial advice. It does not constitute a recommendation to buy or sell any stock, and does not take account of your objectives, or your financial situation. We aim to bring you long-term focused analysis driven by fundamental data. Note that our analysis may not factor in the latest price-sensitive company announcements or qualitative material. Simply Wall St has no position in any stocks mentioned.
About SEHK:3603
Xinji Shaxi Group
An investment holding company, operates and manages hospitality supplies and home furnishing shopping malls in the People’s Republic of China.
Good value with adequate balance sheet.
Market Insights

Advertisement
Community Narratives
MINISO's fair value is projected at 26.69 with an anticipated PE ratio shift of 20x
Fair Value US$24.03|11.4% undervalued
BE
Community Contributor
Procter & Gamble: A Dividend Giant Facing Slowing Growth
Fair Value US$119.81|23.5% overvalued
AN
Community Contributor
Eli Lilly's Future Growth Driven by Tirzepatide and Favorable Market Conditions
Fair Value US$1.19k|14.0% undervalued
EA
Community Contributor