- Hong Kong
- /
- Real Estate
- /
- SEHK:3603
There's Reason For Concern Over Xinji Shaxi Group Co., Ltd's (HKG:3603) Price
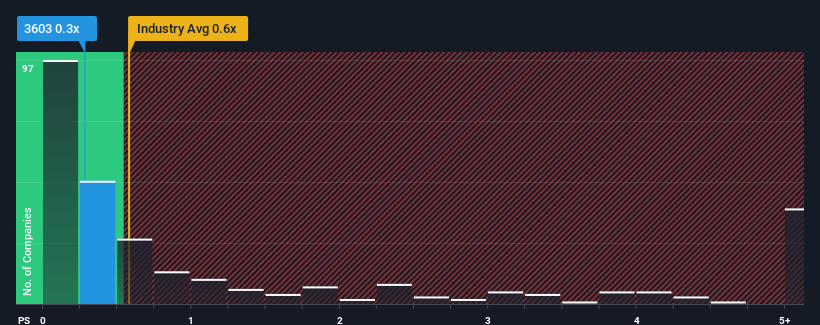
With a median price-to-sales (or "P/S") ratio of close to 0.6x in the Real Estate industry in Hong Kong, you could be forgiven for feeling indifferent about Xinji Shaxi Group Co., Ltd's (HKG:3603) P/S ratio of 0.3x. Although, it's not wise to simply ignore the P/S without explanation as investors may be disregarding a distinct opportunity or a costly mistake.
View our latest analysis for Xinji Shaxi Group

How Has Xinji Shaxi Group Performed Recently?
For instance, Xinji Shaxi Group's receding revenue in recent times would have to be some food for thought. One possibility is that the P/S is moderate because investors think the company might still do enough to be in line with the broader industry in the near future. If not, then existing shareholders may be a little nervous about the viability of the share price.
Want the full picture on earnings, revenue and cash flow for the company? Then our free report on Xinji Shaxi Group will help you shine a light on its historical performance.Do Revenue Forecasts Match The P/S Ratio?
The only time you'd be comfortable seeing a P/S like Xinji Shaxi Group's is when the company's growth is tracking the industry closely.
Retrospectively, the last year delivered a frustrating 6.8% decrease to the company's top line. As a result, revenue from three years ago have also fallen 14% overall. Accordingly, shareholders would have felt downbeat about the medium-term rates of revenue growth.
Weighing that medium-term revenue trajectory against the broader industry's one-year forecast for expansion of 5.6% shows it's an unpleasant look.
In light of this, it's somewhat alarming that Xinji Shaxi Group's P/S sits in line with the majority of other companies. It seems most investors are ignoring the recent poor growth rate and are hoping for a turnaround in the company's business prospects. There's a good chance existing shareholders are setting themselves up for future disappointment if the P/S falls to levels more in line with the recent negative growth rates.
The Final Word
Generally, our preference is to limit the use of the price-to-sales ratio to establishing what the market thinks about the overall health of a company.
The fact that Xinji Shaxi Group currently trades at a P/S on par with the rest of the industry is surprising to us since its recent revenues have been in decline over the medium-term, all while the industry is set to grow. When we see revenue heading backwards in the context of growing industry forecasts, it'd make sense to expect a possible share price decline on the horizon, sending the moderate P/S lower. Unless the recent medium-term conditions improve markedly, investors will have a hard time accepting the share price as fair value.
Before you settle on your opinion, we've discovered 2 warning signs for Xinji Shaxi Group that you should be aware of.
If strong companies turning a profit tickle your fancy, then you'll want to check out this free list of interesting companies that trade on a low P/E (but have proven they can grow earnings).
New: AI Stock Screener & Alerts
Our new AI Stock Screener scans the market every day to uncover opportunities.
• Dividend Powerhouses (3%+ Yield)
• Undervalued Small Caps with Insider Buying
• High growth Tech and AI Companies
Or build your own from over 50 metrics.
Have feedback on this article? Concerned about the content? Get in touch with us directly. Alternatively, email editorial-team (at) simplywallst.com.
This article by Simply Wall St is general in nature. We provide commentary based on historical data and analyst forecasts only using an unbiased methodology and our articles are not intended to be financial advice. It does not constitute a recommendation to buy or sell any stock, and does not take account of your objectives, or your financial situation. We aim to bring you long-term focused analysis driven by fundamental data. Note that our analysis may not factor in the latest price-sensitive company announcements or qualitative material. Simply Wall St has no position in any stocks mentioned.
About SEHK:3603
Xinji Shaxi Group
An investment holding company, operates and manages hospitality supplies and home furnishing shopping malls in the People’s Republic of China.
Good value with adequate balance sheet.
Market Insights
Community Narratives


