
Advertisement
- Hong Kong
- /
- Real Estate
- /
- SEHK:2231
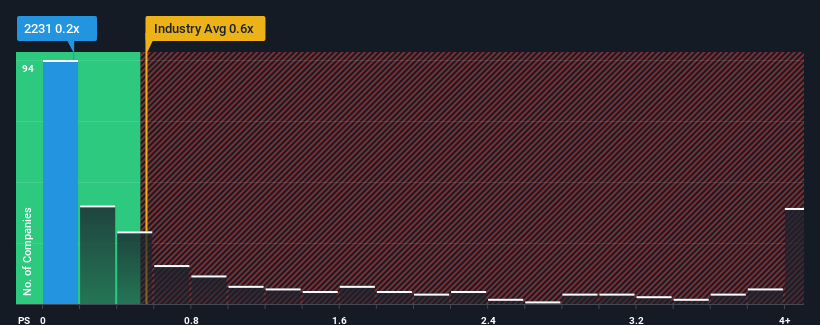
JY Grandmark Holdings Limited's (HKG:2231) 68% Dip Still Leaving Some Shareholders Feeling Restless Over Its P/SRatio

JY Grandmark Holdings Limited (HKG:2231) shareholders that were waiting for something to happen have been dealt a blow with a 68% share price drop in the last month. The recent drop completes a disastrous twelve months for shareholders, who are sitting on a 79% loss during that time.
Even after such a large drop in price, you could still be forgiven for feeling indifferent about JY Grandmark Holdings' P/S ratio of 0.2x, since the median price-to-sales (or "P/S") ratio for the Real Estate industry in Hong Kong is also close to 0.6x. Although, it's not wise to simply ignore the P/S without explanation as investors may be disregarding a distinct opportunity or a costly mistake.
Check out our latest analysis for JY Grandmark Holdings
How Has JY Grandmark Holdings Performed Recently?
Recent times have been quite advantageous for JY Grandmark Holdings as its revenue has been rising very briskly. The P/S is probably moderate because investors think this strong revenue growth might not be enough to outperform the broader industry in the near future. Those who are bullish on JY Grandmark Holdings will be hoping that this isn't the case, so that they can pick up the stock at a lower valuation.
Although there are no analyst estimates available for JY Grandmark Holdings, take a look at this free data-rich visualisation to see how the company stacks up on earnings, revenue and cash flow.Do Revenue Forecasts Match The P/S Ratio?
There's an inherent assumption that a company should be matching the industry for P/S ratios like JY Grandmark Holdings' to be considered reasonable.
Retrospectively, the last year delivered an explosive gain to the company's top line. Still, revenue has barely risen at all from three years ago in total, which is not ideal. Therefore, it's fair to say that revenue growth has been inconsistent recently for the company.
Comparing that to the industry, which is predicted to deliver 5.3% growth in the next 12 months, the company's momentum is weaker, based on recent medium-term annualised revenue results.
With this information, we find it interesting that JY Grandmark Holdings is trading at a fairly similar P/S compared to the industry. Apparently many investors in the company are less bearish than recent times would indicate and aren't willing to let go of their stock right now. Maintaining these prices will be difficult to achieve as a continuation of recent revenue trends is likely to weigh down the shares eventually.
What Does JY Grandmark Holdings' P/S Mean For Investors?
JY Grandmark Holdings' plummeting stock price has brought its P/S back to a similar region as the rest of the industry. It's argued the price-to-sales ratio is an inferior measure of value within certain industries, but it can be a powerful business sentiment indicator.
We've established that JY Grandmark Holdings' average P/S is a bit surprising since its recent three-year growth is lower than the wider industry forecast. Right now we are uncomfortable with the P/S as this revenue performance isn't likely to support a more positive sentiment for long. Unless the recent medium-term conditions improve, it's hard to accept the current share price as fair value.
There are also other vital risk factors to consider and we've discovered 3 warning signs for JY Grandmark Holdings (2 shouldn't be ignored!) that you should be aware of before investing here.
If these risks are making you reconsider your opinion on JY Grandmark Holdings, explore our interactive list of high quality stocks to get an idea of what else is out there.
New: Manage All Your Stock Portfolios in One Place
We've created the ultimate portfolio companion for stock investors, and it's free.
• Connect an unlimited number of Portfolios and see your total in one currency
• Be alerted to new Warning Signs or Risks via email or mobile
• Track the Fair Value of your stocks
Have feedback on this article? Concerned about the content? Get in touch with us directly. Alternatively, email editorial-team (at) simplywallst.com.
This article by Simply Wall St is general in nature. We provide commentary based on historical data and analyst forecasts only using an unbiased methodology and our articles are not intended to be financial advice. It does not constitute a recommendation to buy or sell any stock, and does not take account of your objectives, or your financial situation. We aim to bring you long-term focused analysis driven by fundamental data. Note that our analysis may not factor in the latest price-sensitive company announcements or qualitative material. Simply Wall St has no position in any stocks mentioned.
About SEHK:2231
JY Grandmark Holdings
An investment holding company, engages in the property development activities in the People's Republic of China.
Slightly overvalued with imperfect balance sheet.
Market Insights

Advertisement
Community Narratives

BMW cruising ahead with new EVs and premium models to boost revenue 5%
Fair Value €135.07|44.6% undervalued
UN
Community Contributor
EU#2 - From Humble Beginnings to Global Powerhouse
Fair Value DKK 851.04|46.4% undervalued
TO
Community Contributor