
Advertisement
Howard Marks put it nicely when he said that, rather than worrying about share price volatility, 'The possibility of permanent loss is the risk I worry about... and every practical investor I know worries about.' It's only natural to consider a company's balance sheet when you examine how risky it is, since debt is often involved when a business collapses. We note that Henderson Land Development Company Limited (HKG:12) does have debt on its balance sheet. But the more important question is: how much risk is that debt creating?
When Is Debt Dangerous?
Debt assists a business until the business has trouble paying it off, either with new capital or with free cash flow. If things get really bad, the lenders can take control of the business. However, a more frequent (but still costly) occurrence is where a company must issue shares at bargain-basement prices, permanently diluting shareholders, just to shore up its balance sheet. By replacing dilution, though, debt can be an extremely good tool for businesses that need capital to invest in growth at high rates of return. The first thing to do when considering how much debt a business uses is to look at its cash and debt together.
How Much Debt Does Henderson Land Development Carry?
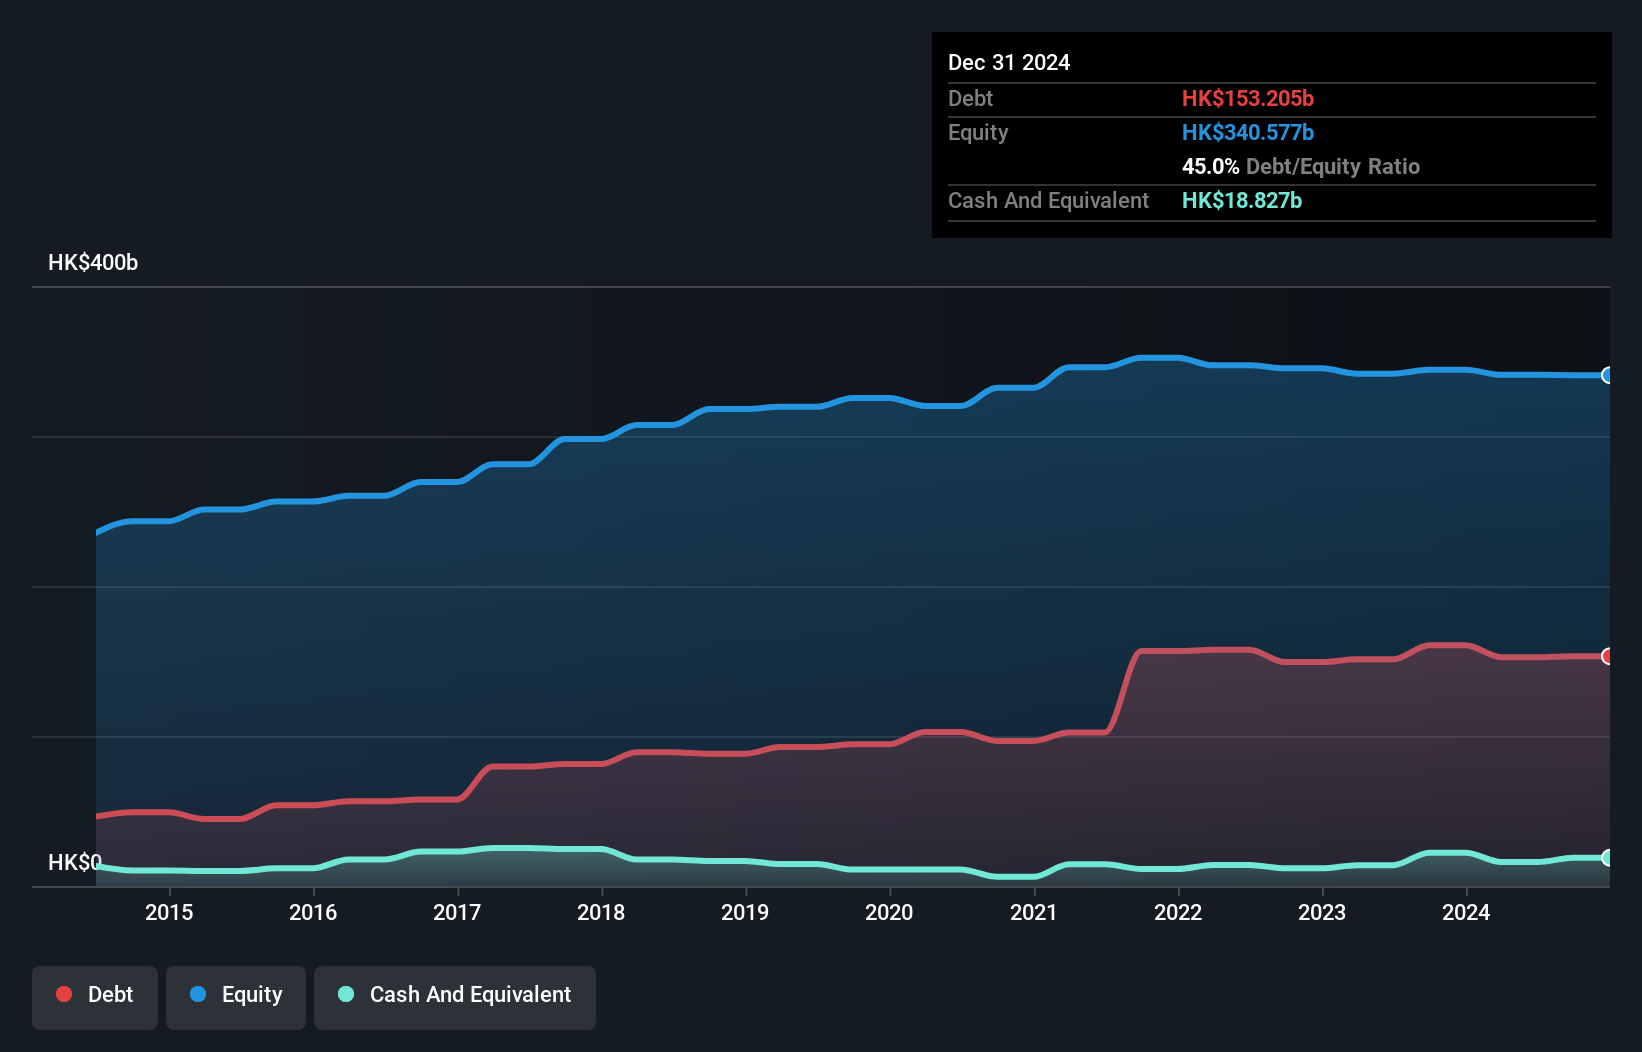
The image below, which you can click on for greater detail, shows that Henderson Land Development had debt of HK$153.2b at the end of December 2024, a reduction from HK$160.4b over a year. However, because it has a cash reserve of HK$18.8b, its net debt is less, at about HK$134.4b.
How Healthy Is Henderson Land Development's Balance Sheet?
We can see from the most recent balance sheet that Henderson Land Development had liabilities of HK$45.8b falling due within a year, and liabilities of HK$144.9b due beyond that. Offsetting these obligations, it had cash of HK$18.8b as well as receivables valued at HK$8.91b due within 12 months. So it has liabilities totalling HK$162.9b more than its cash and near-term receivables, combined.
Given this deficit is actually higher than the company's massive market capitalization of HK$133.6b, we think shareholders really should watch Henderson Land Development's debt levels, like a parent watching their child ride a bike for the first time. Hypothetically, extremely heavy dilution would be required if the company were forced to pay down its liabilities by raising capital at the current share price.
View our latest analysis for Henderson Land Development
We use two main ratios to inform us about debt levels relative to earnings. The first is net debt divided by earnings before interest, tax, depreciation, and amortization (EBITDA), while the second is how many times its earnings before interest and tax (EBIT) covers its interest expense (or its interest cover, for short). Thus we consider debt relative to earnings both with and without depreciation and amortization expenses.
Henderson Land Development has a rather high debt to EBITDA ratio of 25.3 which suggests a meaningful debt load. However, its interest coverage of 2.8 is reasonably strong, which is a good sign. Investors should also be troubled by the fact that Henderson Land Development saw its EBIT drop by 20% over the last twelve months. If that's the way things keep going handling the debt load will be like delivering hot coffees on a pogo stick. When analysing debt levels, the balance sheet is the obvious place to start. But ultimately the future profitability of the business will decide if Henderson Land Development can strengthen its balance sheet over time. So if you want to see what the professionals think, you might find this free report on analyst profit forecasts to be interesting.
Finally, a business needs free cash flow to pay off debt; accounting profits just don't cut it. So we clearly need to look at whether that EBIT is leading to corresponding free cash flow. Over the last three years, Henderson Land Development actually produced more free cash flow than EBIT. That sort of strong cash generation warms our hearts like a puppy in a bumblebee suit.
Our View
On the face of it, Henderson Land Development's EBIT growth rate left us tentative about the stock, and its net debt to EBITDA was no more enticing than the one empty restaurant on the busiest night of the year. But at least it's pretty decent at converting EBIT to free cash flow; that's encouraging. Overall, it seems to us that Henderson Land Development's balance sheet is really quite a risk to the business. So we're almost as wary of this stock as a hungry kitten is about falling into its owner's fish pond: once bitten, twice shy, as they say. The balance sheet is clearly the area to focus on when you are analysing debt. But ultimately, every company can contain risks that exist outside of the balance sheet. We've identified 2 warning signs with Henderson Land Development , and understanding them should be part of your investment process.
If, after all that, you're more interested in a fast growing company with a rock-solid balance sheet, then check out our list of net cash growth stocks without delay.
Valuation is complex, but we're here to simplify it.
Discover if Henderson Land Development might be undervalued or overvalued with our detailed analysis, featuring fair value estimates, potential risks, dividends, insider trades, and its financial condition.
Access Free AnalysisHave feedback on this article? Concerned about the content? Get in touch with us directly. Alternatively, email editorial-team (at) simplywallst.com.
This article by Simply Wall St is general in nature. We provide commentary based on historical data and analyst forecasts only using an unbiased methodology and our articles are not intended to be financial advice. It does not constitute a recommendation to buy or sell any stock, and does not take account of your objectives, or your financial situation. We aim to bring you long-term focused analysis driven by fundamental data. Note that our analysis may not factor in the latest price-sensitive company announcements or qualitative material. Simply Wall St has no position in any stocks mentioned.
About SEHK:12
Henderson Land Development
An investment holding company, engages in the property development and investment activities in Hong Kong and Mainland China.
Moderate growth potential second-rate dividend payer.
Similar Companies
Market Insights

Advertisement
Community Narratives
MicroVision will explode future revenue by 380.37% with a vision towards success
Fair Value US$60.00|98.4% undervalued
TH
Community Contributor
The Indispensable Artery for a New North American Economy
Fair Value CA$132.87|1.3% undervalued
TI
Community Contributor