
Advertisement
- Hong Kong
- /
- Real Estate
- /
- SEHK:1030
Seazen Group Limited (HKG:1030) Held Back By Insufficient Growth Even After Shares Climb 53%
The Seazen Group Limited (HKG:1030) share price has done very well over the last month, posting an excellent gain of 53%. Looking back a bit further, it's encouraging to see the stock is up 63% in the last year.
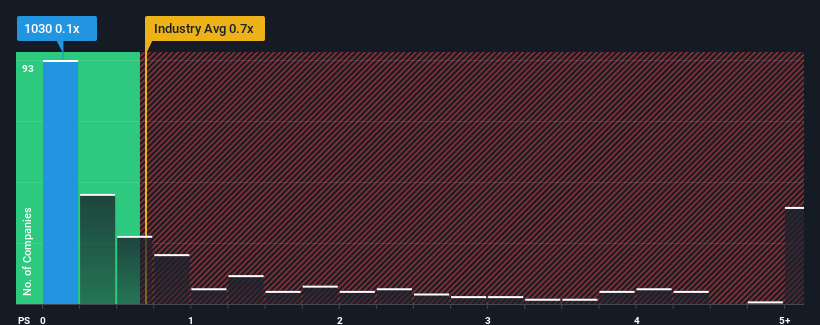
Although its price has surged higher, Seazen Group may still be sending bullish signals at the moment with its price-to-sales (or "P/S") ratio of 0.1x, since almost half of all companies in the Real Estate industry in Hong Kong have P/S ratios greater than 0.7x and even P/S higher than 3x are not unusual. Although, it's not wise to just take the P/S at face value as there may be an explanation why it's limited.
View our latest analysis for Seazen Group
What Does Seazen Group's Recent Performance Look Like?
Seazen Group hasn't been tracking well recently as its declining revenue compares poorly to other companies, which have seen some growth in their revenues on average. It seems that many are expecting the poor revenue performance to persist, which has repressed the P/S ratio. If you still like the company, you'd be hoping this isn't the case so that you could potentially pick up some stock while it's out of favour.
If you'd like to see what analysts are forecasting going forward, you should check out our free report on Seazen Group.What Are Revenue Growth Metrics Telling Us About The Low P/S?
The only time you'd be truly comfortable seeing a P/S as low as Seazen Group's is when the company's growth is on track to lag the industry.
Retrospectively, the last year delivered a frustrating 4.1% decrease to the company's top line. This means it has also seen a slide in revenue over the longer-term as revenue is down 41% in total over the last three years. Accordingly, shareholders would have felt downbeat about the medium-term rates of revenue growth.
Looking ahead now, revenue is anticipated to slump, contracting by 30% during the coming year according to the nine analysts following the company. With the industry predicted to deliver 5.1% growth, that's a disappointing outcome.
With this information, we are not surprised that Seazen Group is trading at a P/S lower than the industry. However, shrinking revenues are unlikely to lead to a stable P/S over the longer term. Even just maintaining these prices could be difficult to achieve as the weak outlook is weighing down the shares.
What Does Seazen Group's P/S Mean For Investors?
The latest share price surge wasn't enough to lift Seazen Group's P/S close to the industry median. We'd say the price-to-sales ratio's power isn't primarily as a valuation instrument but rather to gauge current investor sentiment and future expectations.
It's clear to see that Seazen Group maintains its low P/S on the weakness of its forecast for sliding revenue, as expected. Right now shareholders are accepting the low P/S as they concede future revenue probably won't provide any pleasant surprises. It's hard to see the share price rising strongly in the near future under these circumstances.
There are also other vital risk factors to consider and we've discovered 2 warning signs for Seazen Group (1 is a bit concerning!) that you should be aware of before investing here.
Of course, profitable companies with a history of great earnings growth are generally safer bets. So you may wish to see this free collection of other companies that have reasonable P/E ratios and have grown earnings strongly.
New: Manage All Your Stock Portfolios in One Place
We've created the ultimate portfolio companion for stock investors, and it's free.
• Connect an unlimited number of Portfolios and see your total in one currency
• Be alerted to new Warning Signs or Risks via email or mobile
• Track the Fair Value of your stocks
Have feedback on this article? Concerned about the content? Get in touch with us directly. Alternatively, email editorial-team (at) simplywallst.com.
This article by Simply Wall St is general in nature. We provide commentary based on historical data and analyst forecasts only using an unbiased methodology and our articles are not intended to be financial advice. It does not constitute a recommendation to buy or sell any stock, and does not take account of your objectives, or your financial situation. We aim to bring you long-term focused analysis driven by fundamental data. Note that our analysis may not factor in the latest price-sensitive company announcements or qualitative material. Simply Wall St has no position in any stocks mentioned.
About SEHK:1030
Seazen Group
Engages in the investment, development, management, and sale of properties in the People’s Republic of China.
Moderate growth potential with questionable track record.
Similar Companies
Market Insights

Advertisement
Community Narratives
Kodiak AI - a potential 100 bagger opportunity?
Fair Value US$14.00|41.9% undervalued
DA
Community Contributor
A Fair Price for a Great Business Facing Real Threats
Fair Value US$383.06|13.0% undervalued
IM
Community Contributor
AXON And Shopify Integration Will Unlock Global Mobile Advertising
Fair Value US$613.59|2.3% undervalued
AN
Based on Analyst Price Targets