More Unpleasant Surprises Could Be In Store For Mabpharm Limited's (HKG:2181) Shares After Tumbling 41%


The Mabpharm Limited (HKG:2181) share price has fared very poorly over the last month, falling by a substantial 41%. Instead of being rewarded, shareholders who have already held through the last twelve months are now sitting on a 27% share price drop.
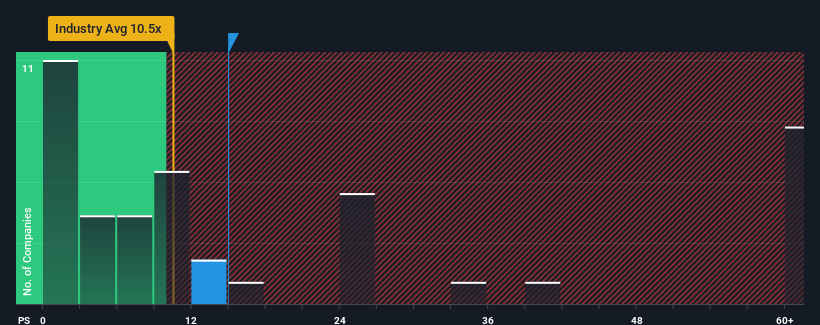
Even after such a large drop in price, Mabpharm may still be sending sell signals at present with a price-to-sales (or "P/S") ratio of 15x, when you consider almost half of the companies in the Biotechs industry in Hong Kong have P/S ratios under 10.5x and even P/S lower than 2x aren't out of the ordinary. However, the P/S might be high for a reason and it requires further investigation to determine if it's justified.
View our latest analysis for Mabpharm
What Does Mabpharm's P/S Mean For Shareholders?
Recent times have been quite advantageous for Mabpharm as its revenue has been rising very briskly. The P/S ratio is probably high because investors think this strong revenue growth will be enough to outperform the broader industry in the near future. You'd really hope so, otherwise you're paying a pretty hefty price for no particular reason.
Want the full picture on earnings, revenue and cash flow for the company? Then our free report on Mabpharm will help you shine a light on its historical performance.Is There Enough Revenue Growth Forecasted For Mabpharm?
In order to justify its P/S ratio, Mabpharm would need to produce impressive growth in excess of the industry.
If we review the last year of revenue growth, the company posted a terrific increase of 133%. This great performance means it was also able to deliver immense revenue growth over the last three years. Therefore, it's fair to say the revenue growth recently has been superb for the company.
It's interesting to note that the rest of the industry is similarly expected to grow by 82% over the next year, which is fairly even with the company's recent medium-term annualised growth rates.
With this in mind, we find it intriguing that Mabpharm's P/S exceeds that of its industry peers. Apparently many investors in the company are more bullish than recent times would indicate and aren't willing to let go of their stock right now. Nevertheless, they may be setting themselves up for future disappointment if the P/S falls to levels more in line with recent growth rates.
The Bottom Line On Mabpharm's P/S
There's still some elevation in Mabpharm's P/S, even if the same can't be said for its share price recently. It's argued the price-to-sales ratio is an inferior measure of value within certain industries, but it can be a powerful business sentiment indicator.
Our look into Mabpharm has shown that it currently trades on a higher than expected P/S since its recent three-year growth is only in line with the wider industry forecast. Right now we are uncomfortable with the high P/S as this revenue performance isn't likely to support such positive sentiment for long. If recent medium-term revenue trends continue, it will place shareholders' investments at risk and potential investors in danger of paying an unnecessary premium.
We don't want to rain on the parade too much, but we did also find 3 warning signs for Mabpharm (2 can't be ignored!) that you need to be mindful of.
If strong companies turning a profit tickle your fancy, then you'll want to check out this free list of interesting companies that trade on a low P/E (but have proven they can grow earnings).
New: Manage All Your Stock Portfolios in One Place
We've created the ultimate portfolio companion for stock investors, and it's free.
• Connect an unlimited number of Portfolios and see your total in one currency
• Be alerted to new Warning Signs or Risks via email or mobile
• Track the Fair Value of your stocks
Have feedback on this article? Concerned about the content? Get in touch with us directly. Alternatively, email editorial-team (at) simplywallst.com.
This article by Simply Wall St is general in nature. We provide commentary based on historical data and analyst forecasts only using an unbiased methodology and our articles are not intended to be financial advice. It does not constitute a recommendation to buy or sell any stock, and does not take account of your objectives, or your financial situation. We aim to bring you long-term focused analysis driven by fundamental data. Note that our analysis may not factor in the latest price-sensitive company announcements or qualitative material. Simply Wall St has no position in any stocks mentioned.
About SEHK:2181
Mabpharm
A biopharmaceutical company, engages in research, development, production, and commercialization of drugs and biosimilar for cancers and autoimmune diseases in the People’s Republic of China.
Slightly overvalued with imperfect balance sheet.
Market Insights

Community Narratives

