
Advertisement
Take Care Before Jumping Onto HBM Holdings Limited (HKG:2142) Even Though It's 28% Cheaper
The HBM Holdings Limited (HKG:2142) share price has fared very poorly over the last month, falling by a substantial 28%. For any long-term shareholders, the last month ends a year to forget by locking in a 54% share price decline.
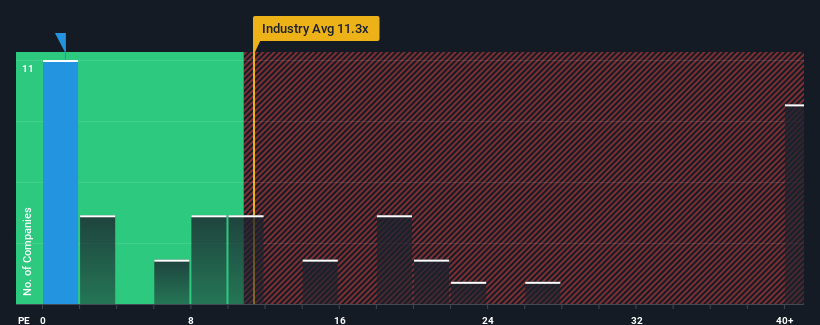
After such a large drop in price, HBM Holdings may be sending very bullish signals at the moment with its price-to-sales (or "P/S") ratio of 1.2x, since almost half of all companies in the Biotechs industry in Hong Kong have P/S ratios greater than 11.3x and even P/S higher than 24x are not unusual. However, the P/S might be quite low for a reason and it requires further investigation to determine if it's justified.
View our latest analysis for HBM Holdings
How Has HBM Holdings Performed Recently?
With revenue growth that's exceedingly strong of late, HBM Holdings has been doing very well. Perhaps the market is expecting future revenue performance to dwindle, which has kept the P/S suppressed. If you like the company, you'd be hoping this isn't the case so that you could potentially pick up some stock while it's out of favour.
We don't have analyst forecasts, but you can see how recent trends are setting up the company for the future by checking out our free report on HBM Holdings' earnings, revenue and cash flow.Do Revenue Forecasts Match The Low P/S Ratio?
In order to justify its P/S ratio, HBM Holdings would need to produce anemic growth that's substantially trailing the industry.
If we review the last year of revenue growth, the company posted a terrific increase of 120%. Spectacularly, three year revenue growth has ballooned by several orders of magnitude, thanks in part to the last 12 months of revenue growth. So we can start by confirming that the company has done a tremendous job of growing revenue over that time.
This is in contrast to the rest of the industry, which is expected to grow by 43% over the next year, materially lower than the company's recent medium-term annualised growth rates.
With this information, we find it odd that HBM Holdings is trading at a P/S lower than the industry. Apparently some shareholders believe the recent performance has exceeded its limits and have been accepting significantly lower selling prices.
The Bottom Line On HBM Holdings' P/S
Shares in HBM Holdings have plummeted and its P/S has followed suit. Generally, our preference is to limit the use of the price-to-sales ratio to establishing what the market thinks about the overall health of a company.
Our examination of HBM Holdings revealed its three-year revenue trends aren't boosting its P/S anywhere near as much as we would have predicted, given they look better than current industry expectations. When we see robust revenue growth that outpaces the industry, we presume that there are notable underlying risks to the company's future performance, which is exerting downward pressure on the P/S ratio. While recent revenue trends over the past medium-term suggest that the risk of a price decline is low, investors appear to perceive a likelihood of revenue fluctuations in the future.
Many other vital risk factors can be found on the company's balance sheet. Our free balance sheet analysis for HBM Holdings with six simple checks will allow you to discover any risks that could be an issue.
If companies with solid past earnings growth is up your alley, you may wish to see this free collection of other companies with strong earnings growth and low P/E ratios.
Valuation is complex, but we're here to simplify it.
Discover if HBM Holdings might be undervalued or overvalued with our detailed analysis, featuring fair value estimates, potential risks, dividends, insider trades, and its financial condition.
Access Free AnalysisHave feedback on this article? Concerned about the content? Get in touch with us directly. Alternatively, email editorial-team (at) simplywallst.com.
This article by Simply Wall St is general in nature. We provide commentary based on historical data and analyst forecasts only using an unbiased methodology and our articles are not intended to be financial advice. It does not constitute a recommendation to buy or sell any stock, and does not take account of your objectives, or your financial situation. We aim to bring you long-term focused analysis driven by fundamental data. Note that our analysis may not factor in the latest price-sensitive company announcements or qualitative material. Simply Wall St has no position in any stocks mentioned.
About SEHK:2142
HBM Holdings
A biopharmaceutical company, engages in the discovery, development, and commercialization of antibody therapeutics focusing on immunology and oncology in Mainland China, the United States, Europe, and internationally.
Flawless balance sheet with solid track record.
Market Insights

Advertisement
Community Narratives
The Next Phase of Energy Storage: How NeoVolta Is Tackling America’s Power Crunch
Fair Value US$7.50|35.1% undervalued
MA
Community Contributor
Why EnSilica is Worth Possibly 13x its Current Price
Fair Value UK£5.00|89.8% undervalued
DO
Community Contributor
M&A Activity, Industry Diversification & A Defense Contract Monopoly Will Push BWXT For Healthy Long-Term Growth
Fair Value US$220.00|15.2% undervalued
CL
Community Contributor
A case for Cassiar Gold Corp (TSXV: GLDC) to reach CAD$8-10 before 2030 (X30-37)
Fair Value CA$10.00|96.0% undervalued
AG
Community Contributor