
Advertisement
Investors Still Aren't Entirely Convinced By HBM Holdings Limited's (HKG:2142) Revenues Despite 30% Price Jump

HBM Holdings Limited (HKG:2142) shares have had a really impressive month, gaining 30% after a shaky period beforehand. Notwithstanding the latest gain, the annual share price return of 6.5% isn't as impressive.
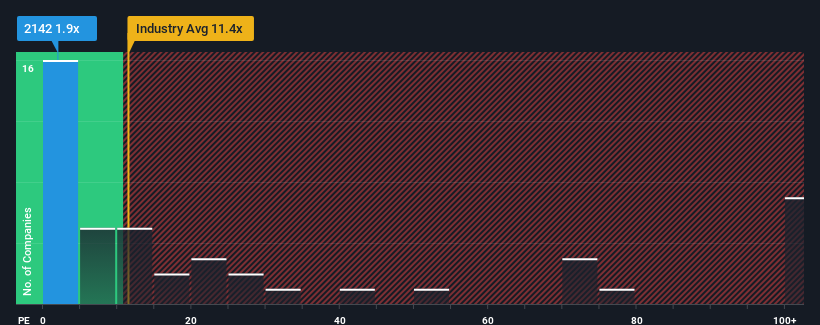
Although its price has surged higher, HBM Holdings may still be sending very bullish signals at the moment with its price-to-sales (or "P/S") ratio of 1.9x, since almost half of all companies in the Biotechs industry in Hong Kong have P/S ratios greater than 11.4x and even P/S higher than 55x are not unusual. Although, it's not wise to just take the P/S at face value as there may be an explanation why it's so limited.
Check out our latest analysis for HBM Holdings
What Does HBM Holdings' P/S Mean For Shareholders?
With revenue growth that's exceedingly strong of late, HBM Holdings has been doing very well. Perhaps the market is expecting future revenue performance to dwindle, which has kept the P/S suppressed. If you like the company, you'd be hoping this isn't the case so that you could potentially pick up some stock while it's out of favour.
We don't have analyst forecasts, but you can see how recent trends are setting up the company for the future by checking out our free report on HBM Holdings' earnings, revenue and cash flow.What Are Revenue Growth Metrics Telling Us About The Low P/S?
HBM Holdings' P/S ratio would be typical for a company that's expected to deliver very poor growth or even falling revenue, and importantly, perform much worse than the industry.
Taking a look back first, we see that the company grew revenue by an impressive 34% last year. This great performance means it was also able to deliver immense revenue growth over the last three years. Therefore, it's fair to say the revenue growth recently has been superb for the company.
It's interesting to note that the rest of the industry is similarly expected to grow by 87% over the next year, which is fairly even with the company's recent medium-term annualised growth rates.
With this in consideration, we find it intriguing that HBM Holdings' P/S falls short of its industry peers. Apparently some shareholders are more bearish than recent times would indicate and have been accepting lower selling prices.
The Bottom Line On HBM Holdings' P/S
Shares in HBM Holdings have risen appreciably however, its P/S is still subdued. Using the price-to-sales ratio alone to determine if you should sell your stock isn't sensible, however it can be a practical guide to the company's future prospects.
The fact that HBM Holdings currently trades at a low P/S relative to the industry is unexpected considering its recent three-year growth is in line with the wider industry forecast. When we see industry-like revenue growth but a lower than expected P/S, we assume potential risks are what might be placing downward pressure on the share price. At least the risk of a price drop looks to be subdued if recent medium-term revenue trends continue, but investors seem to think future revenue could see some volatility.
Before you take the next step, you should know about the 1 warning sign for HBM Holdings that we have uncovered.
It's important to make sure you look for a great company, not just the first idea you come across. So if growing profitability aligns with your idea of a great company, take a peek at this free list of interesting companies with strong recent earnings growth (and a low P/E).
Valuation is complex, but we're here to simplify it.
Discover if HBM Holdings might be undervalued or overvalued with our detailed analysis, featuring fair value estimates, potential risks, dividends, insider trades, and its financial condition.
Access Free AnalysisHave feedback on this article? Concerned about the content? Get in touch with us directly. Alternatively, email editorial-team (at) simplywallst.com.
This article by Simply Wall St is general in nature. We provide commentary based on historical data and analyst forecasts only using an unbiased methodology and our articles are not intended to be financial advice. It does not constitute a recommendation to buy or sell any stock, and does not take account of your objectives, or your financial situation. We aim to bring you long-term focused analysis driven by fundamental data. Note that our analysis may not factor in the latest price-sensitive company announcements or qualitative material. Simply Wall St has no position in any stocks mentioned.
About SEHK:2142
HBM Holdings
A clinical-stage biopharmaceutical company, engages in the discovery, development, and commercialization of novel antibody therapeutics in immunology and oncology disease areas.
Excellent balance sheet low.
Market Insights

Advertisement
Community Narratives
Groundbreaking therapies that could change the treatment landscape for PTSD, fibromyalgia, MS & Alzheimer’s
Fair Value US$6.20|86.9% undervalued
CM
Community Contributor
DigitalOcean Will Grow 14% by Embracing AI with Paperspace Acquisition
Fair Value US$50.00|40.2% undervalued
NE
Community Contributor
Viant Technology: A Rising AdTech Challenger in the AI-Powered CTV Market
Fair Value US$38.61|62.7% undervalued
BL
Community Contributor
Volvo will Accelerate Forward into Electric and Autonomous Leadership in Five Years
Fair Value SEK 438.80|40.1% undervalued
UN
Community Contributor