Why Simcere Pharmaceutical Group's (HKG:2096) Shaky Earnings Are Just The Beginning Of Its Problems


Simcere Pharmaceutical Group Limited's (HKG:2096) recent weak earnings report didn't cause a big stock movement. Our analysis suggests that along with soft profit numbers, investors should be aware of some other underlying weaknesses in the numbers.
See our latest analysis for Simcere Pharmaceutical Group
Examining Cashflow Against Simcere Pharmaceutical Group's Earnings
Many investors haven't heard of the accrual ratio from cashflow, but it is actually a useful measure of how well a company's profit is backed up by free cash flow (FCF) during a given period. In plain english, this ratio subtracts FCF from net profit, and divides that number by the company's average operating assets over that period. You could think of the accrual ratio from cashflow as the 'non-FCF profit ratio'.
Therefore, it's actually considered a good thing when a company has a negative accrual ratio, but a bad thing if its accrual ratio is positive. While it's not a problem to have a positive accrual ratio, indicating a certain level of non-cash profits, a high accrual ratio is arguably a bad thing, because it indicates paper profits are not matched by cash flow. Notably, there is some academic evidence that suggests that a high accrual ratio is a bad sign for near-term profits, generally speaking.
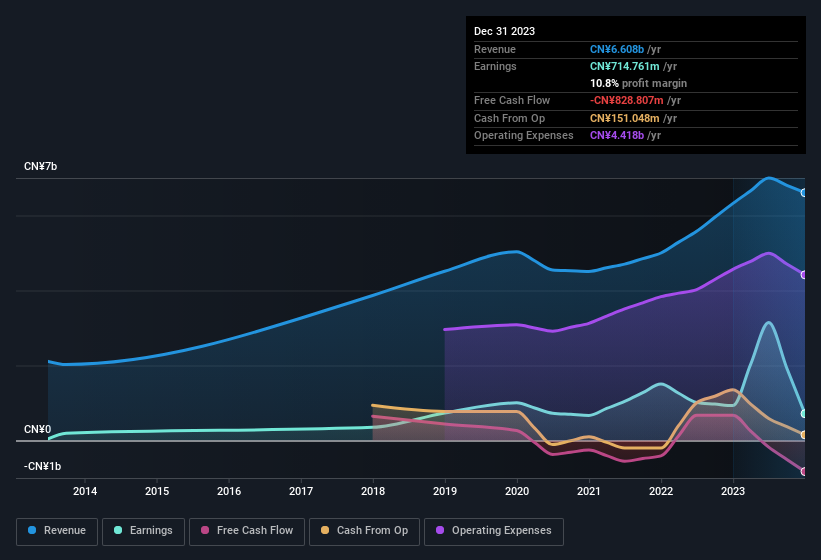
Over the twelve months to December 2023, Simcere Pharmaceutical Group recorded an accrual ratio of 0.25. We can therefore deduce that its free cash flow fell well short of covering its statutory profit. Even though it reported a profit of CN¥714.8m, a look at free cash flow indicates it actually burnt through CN¥829m in the last year. It's worth noting that Simcere Pharmaceutical Group generated positive FCF of CN¥676m a year ago, so at least they've done it in the past.
That might leave you wondering what analysts are forecasting in terms of future profitability. Luckily, you can click here to see an interactive graph depicting future profitability, based on their estimates.
Our Take On Simcere Pharmaceutical Group's Profit Performance
Simcere Pharmaceutical Group's accrual ratio for the last twelve months signifies cash conversion is less than ideal, which is a negative when it comes to our view of its earnings. Because of this, we think that it may be that Simcere Pharmaceutical Group's statutory profits are better than its underlying earnings power. Sadly, its EPS was down over the last twelve months. Of course, we've only just scratched the surface when it comes to analysing its earnings; one could also consider margins, forecast growth, and return on investment, among other factors. Keep in mind, when it comes to analysing a stock it's worth noting the risks involved. While conducting our analysis, we found that Simcere Pharmaceutical Group has 1 warning sign and it would be unwise to ignore this.
Today we've zoomed in on a single data point to better understand the nature of Simcere Pharmaceutical Group's profit. But there is always more to discover if you are capable of focussing your mind on minutiae. For example, many people consider a high return on equity as an indication of favorable business economics, while others like to 'follow the money' and search out stocks that insiders are buying. While it might take a little research on your behalf, you may find this free collection of companies boasting high return on equity, or this list of stocks that insiders are buying to be useful.
If you're looking to trade Simcere Pharmaceutical Group, open an account with the lowest-cost platform trusted by professionals, Interactive Brokers.
With clients in over 200 countries and territories, and access to 160 markets, IBKR lets you trade stocks, options, futures, forex, bonds and funds from a single integrated account.
Enjoy no hidden fees, no account minimums, and FX conversion rates as low as 0.03%, far better than what most brokers offer.
Sponsored ContentNew: Manage All Your Stock Portfolios in One Place
We've created the ultimate portfolio companion for stock investors, and it's free.
• Connect an unlimited number of Portfolios and see your total in one currency
• Be alerted to new Warning Signs or Risks via email or mobile
• Track the Fair Value of your stocks
Have feedback on this article? Concerned about the content? Get in touch with us directly. Alternatively, email editorial-team (at) simplywallst.com.
This article by Simply Wall St is general in nature. We provide commentary based on historical data and analyst forecasts only using an unbiased methodology and our articles are not intended to be financial advice. It does not constitute a recommendation to buy or sell any stock, and does not take account of your objectives, or your financial situation. We aim to bring you long-term focused analysis driven by fundamental data. Note that our analysis may not factor in the latest price-sensitive company announcements or qualitative material. Simply Wall St has no position in any stocks mentioned.
About SEHK:2096
Simcere Pharmaceutical Group
Engages in the research, development, manufacture, and sale of pharmaceutical products for distributors and pharmacy chains and other pharmaceutical manufacturers in China.
Flawless balance sheet with reasonable growth potential.
Market Insights

Community Narratives

