
Advertisement

David Iben put it well when he said, 'Volatility is not a risk we care about. What we care about is avoiding the permanent loss of capital.' When we think about how risky a company is, we always like to look at its use of debt, since debt overload can lead to ruin. We note that SSY Group Limited (HKG:2005) does have debt on its balance sheet. But is this debt a concern to shareholders?
What Risk Does Debt Bring?
Debt is a tool to help businesses grow, but if a business is incapable of paying off its lenders, then it exists at their mercy. In the worst case scenario, a company can go bankrupt if it cannot pay its creditors. However, a more common (but still painful) scenario is that it has to raise new equity capital at a low price, thus permanently diluting shareholders. Of course, plenty of companies use debt to fund growth, without any negative consequences. When we examine debt levels, we first consider both cash and debt levels, together.
Our analysis indicates that 2005 is potentially undervalued!
How Much Debt Does SSY Group Carry?
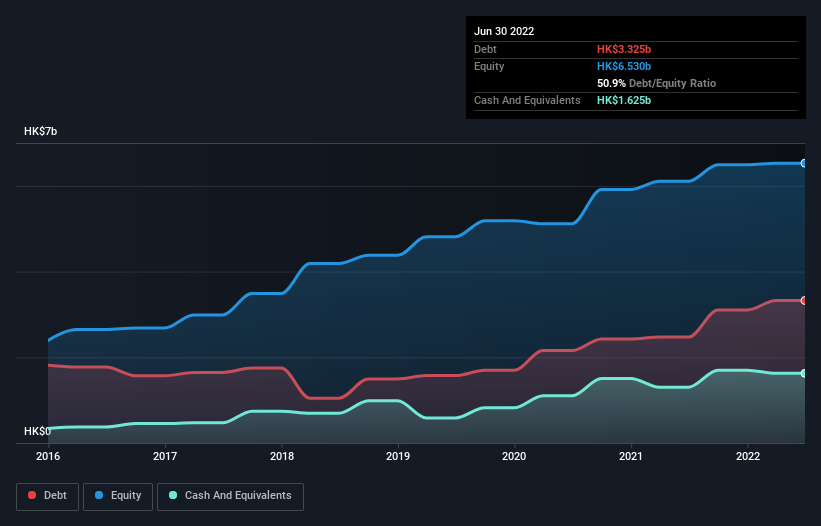
You can click the graphic below for the historical numbers, but it shows that as of June 2022 SSY Group had HK$3.33b of debt, an increase on HK$2.47b, over one year. On the flip side, it has HK$1.63b in cash leading to net debt of about HK$1.70b.
How Strong Is SSY Group's Balance Sheet?
Zooming in on the latest balance sheet data, we can see that SSY Group had liabilities of HK$3.21b due within 12 months and liabilities of HK$1.24b due beyond that. On the other hand, it had cash of HK$1.63b and HK$2.31b worth of receivables due within a year. So its liabilities outweigh the sum of its cash and (near-term) receivables by HK$512.7m.
Of course, SSY Group has a market capitalization of HK$11.6b, so these liabilities are probably manageable. Having said that, it's clear that we should continue to monitor its balance sheet, lest it change for the worse.
We measure a company's debt load relative to its earnings power by looking at its net debt divided by its earnings before interest, tax, depreciation, and amortization (EBITDA) and by calculating how easily its earnings before interest and tax (EBIT) cover its interest expense (interest cover). This way, we consider both the absolute quantum of the debt, as well as the interest rates paid on it.
SSY Group has a low net debt to EBITDA ratio of only 0.97. And its EBIT easily covers its interest expense, being 31.7 times the size. So we're pretty relaxed about its super-conservative use of debt. In addition to that, we're happy to report that SSY Group has boosted its EBIT by 57%, thus reducing the spectre of future debt repayments. The balance sheet is clearly the area to focus on when you are analysing debt. But ultimately the future profitability of the business will decide if SSY Group can strengthen its balance sheet over time. So if you want to see what the professionals think, you might find this free report on analyst profit forecasts to be interesting.
But our final consideration is also important, because a company cannot pay debt with paper profits; it needs cold hard cash. So we clearly need to look at whether that EBIT is leading to corresponding free cash flow. In the last three years, SSY Group created free cash flow amounting to 17% of its EBIT, an uninspiring performance. That limp level of cash conversion undermines its ability to manage and pay down debt.
Our View
The good news is that SSY Group's demonstrated ability to cover its interest expense with its EBIT delights us like a fluffy puppy does a toddler. But, on a more sombre note, we are a little concerned by its conversion of EBIT to free cash flow. Taking all this data into account, it seems to us that SSY Group takes a pretty sensible approach to debt. That means they are taking on a bit more risk, in the hope of boosting shareholder returns. The balance sheet is clearly the area to focus on when you are analysing debt. However, not all investment risk resides within the balance sheet - far from it. These risks can be hard to spot. Every company has them, and we've spotted 1 warning sign for SSY Group you should know about.
If, after all that, you're more interested in a fast growing company with a rock-solid balance sheet, then check out our list of net cash growth stocks without delay.
New: Manage All Your Stock Portfolios in One Place
We've created the ultimate portfolio companion for stock investors, and it's free.
• Connect an unlimited number of Portfolios and see your total in one currency
• Be alerted to new Warning Signs or Risks via email or mobile
• Track the Fair Value of your stocks
Have feedback on this article? Concerned about the content? Get in touch with us directly. Alternatively, email editorial-team (at) simplywallst.com.
This article by Simply Wall St is general in nature. We provide commentary based on historical data and analyst forecasts only using an unbiased methodology and our articles are not intended to be financial advice. It does not constitute a recommendation to buy or sell any stock, and does not take account of your objectives, or your financial situation. We aim to bring you long-term focused analysis driven by fundamental data. Note that our analysis may not factor in the latest price-sensitive company announcements or qualitative material. Simply Wall St has no position in any stocks mentioned.
About SEHK:2005
SSY Group
An investment holding company, research, develops, manufactures, trades in, and sells various pharmaceutical products to hospitals and distributors in the People’s Republic of China and internationally.
Good value with adequate balance sheet.
Market Insights

Advertisement
Community Narratives

BMW cruising ahead with new EVs and premium models to boost revenue 5%
Fair Value €135.07|45.0% undervalued
UN
Community Contributor
EU#2 - From Humble Beginnings to Global Powerhouse
Fair Value DKK 851.04|47.8% undervalued
TO
Community Contributor