Sanai Health Industry Group Company Limited (HKG:1889) Looks Inexpensive After Falling 45% But Perhaps Not Attractive Enough


Unfortunately for some shareholders, the Sanai Health Industry Group Company Limited (HKG:1889) share price has dived 45% in the last thirty days, prolonging recent pain. The recent drop completes a disastrous twelve months for shareholders, who are sitting on a 87% loss during that time.
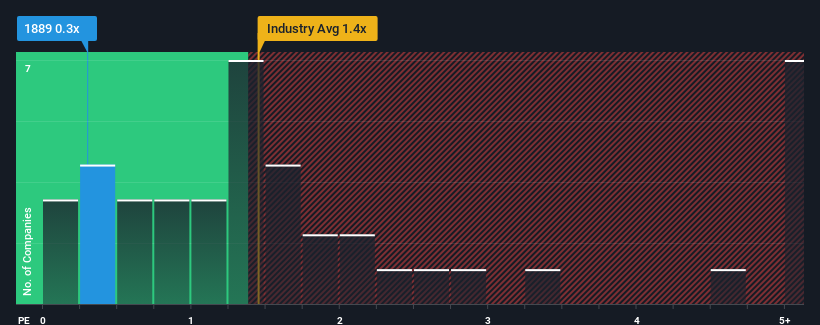
Following the heavy fall in price, when close to half the companies operating in Hong Kong's Pharmaceuticals industry have price-to-sales ratios (or "P/S") above 1.4x, you may consider Sanai Health Industry Group as an enticing stock to check out with its 0.3x P/S ratio. However, the P/S might be low for a reason and it requires further investigation to determine if it's justified.
Check out our latest analysis for Sanai Health Industry Group
What Does Sanai Health Industry Group's Recent Performance Look Like?
As an illustration, revenue has deteriorated at Sanai Health Industry Group over the last year, which is not ideal at all. It might be that many expect the disappointing revenue performance to continue or accelerate, which has repressed the P/S. Those who are bullish on Sanai Health Industry Group will be hoping that this isn't the case so that they can pick up the stock at a lower valuation.
Although there are no analyst estimates available for Sanai Health Industry Group, take a look at this free data-rich visualisation to see how the company stacks up on earnings, revenue and cash flow.What Are Revenue Growth Metrics Telling Us About The Low P/S?
Sanai Health Industry Group's P/S ratio would be typical for a company that's only expected to deliver limited growth, and importantly, perform worse than the industry.
Retrospectively, the last year delivered a frustrating 46% decrease to the company's top line. That put a dampener on the good run it was having over the longer-term as its three-year revenue growth is still a noteworthy 7.9% in total. Accordingly, while they would have preferred to keep the run going, shareholders would be roughly satisfied with the medium-term rates of revenue growth.
Comparing that to the industry, which is predicted to deliver 11% growth in the next 12 months, the company's momentum is weaker, based on recent medium-term annualised revenue results.
With this information, we can see why Sanai Health Industry Group is trading at a P/S lower than the industry. It seems most investors are expecting to see the recent limited growth rates continue into the future and are only willing to pay a reduced amount for the stock.
The Key Takeaway
Sanai Health Industry Group's P/S has taken a dip along with its share price. Generally, our preference is to limit the use of the price-to-sales ratio to establishing what the market thinks about the overall health of a company.
In line with expectations, Sanai Health Industry Group maintains its low P/S on the weakness of its recent three-year growth being lower than the wider industry forecast. Right now shareholders are accepting the low P/S as they concede future revenue probably won't provide any pleasant surprises. If recent medium-term revenue trends continue, it's hard to see the share price experience a reversal of fortunes anytime soon.
We don't want to rain on the parade too much, but we did also find 5 warning signs for Sanai Health Industry Group (2 are potentially serious!) that you need to be mindful of.
If companies with solid past earnings growth is up your alley, you may wish to see this free collection of other companies with strong earnings growth and low P/E ratios.
New: Manage All Your Stock Portfolios in One Place
We've created the ultimate portfolio companion for stock investors, and it's free.
• Connect an unlimited number of Portfolios and see your total in one currency
• Be alerted to new Warning Signs or Risks via email or mobile
• Track the Fair Value of your stocks
Have feedback on this article? Concerned about the content? Get in touch with us directly. Alternatively, email editorial-team (at) simplywallst.com.
This article by Simply Wall St is general in nature. We provide commentary based on historical data and analyst forecasts only using an unbiased methodology and our articles are not intended to be financial advice. It does not constitute a recommendation to buy or sell any stock, and does not take account of your objectives, or your financial situation. We aim to bring you long-term focused analysis driven by fundamental data. Note that our analysis may not factor in the latest price-sensitive company announcements or qualitative material. Simply Wall St has no position in any stocks mentioned.
About SEHK:1889
Sanai Health Industry Group
An investment holding company, engages in the manufacture, marketing, and sale of branded prescription and non-prescription drugs, as well as Chinese pharmaceutical products in the People’s Republic of China and Hong Kong.
Moderate and good value.
Market Insights

Community Narratives


