
Advertisement
- Hong Kong
- /
- Entertainment
- /
- SEHK:6698
Star CM Holdings Limited (HKG:6698) Shares May Have Slumped 29% But Getting In Cheap Is Still Unlikely

To the annoyance of some shareholders, Star CM Holdings Limited (HKG:6698) shares are down a considerable 29% in the last month, which continues a horrid run for the company. For any long-term shareholders, the last month ends a year to forget by locking in a 98% share price decline.
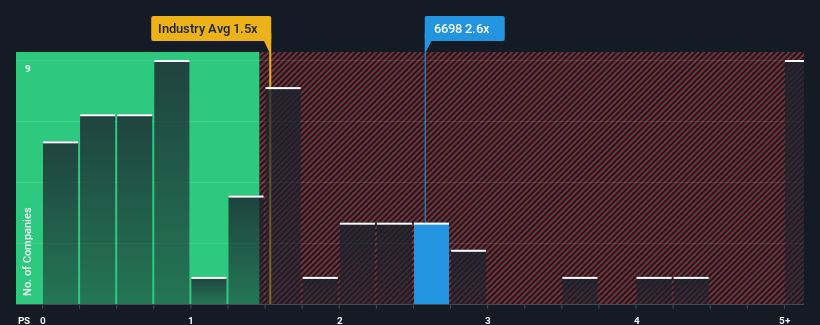
In spite of the heavy fall in price, when almost half of the companies in Hong Kong's Entertainment industry have price-to-sales ratios (or "P/S") below 1.5x, you may still consider Star CM Holdings as a stock probably not worth researching with its 2.6x P/S ratio. Nonetheless, we'd need to dig a little deeper to determine if there is a rational basis for the elevated P/S.
View our latest analysis for Star CM Holdings
How Has Star CM Holdings Performed Recently?
As an illustration, revenue has deteriorated at Star CM Holdings over the last year, which is not ideal at all. Perhaps the market believes the company can do enough to outperform the rest of the industry in the near future, which is keeping the P/S ratio high. If not, then existing shareholders may be quite nervous about the viability of the share price.
Want the full picture on earnings, revenue and cash flow for the company? Then our free report on Star CM Holdings will help you shine a light on its historical performance.Do Revenue Forecasts Match The High P/S Ratio?
The only time you'd be truly comfortable seeing a P/S as high as Star CM Holdings' is when the company's growth is on track to outshine the industry.
Taking a look back first, the company's revenue growth last year wasn't something to get excited about as it posted a disappointing decline of 51%. The last three years don't look nice either as the company has shrunk revenue by 73% in aggregate. Accordingly, shareholders would have felt downbeat about the medium-term rates of revenue growth.
In contrast to the company, the rest of the industry is expected to grow by 21% over the next year, which really puts the company's recent medium-term revenue decline into perspective.
In light of this, it's alarming that Star CM Holdings' P/S sits above the majority of other companies. Apparently many investors in the company are way more bullish than recent times would indicate and aren't willing to let go of their stock at any price. Only the boldest would assume these prices are sustainable as a continuation of recent revenue trends is likely to weigh heavily on the share price eventually.
The Bottom Line On Star CM Holdings' P/S
Despite the recent share price weakness, Star CM Holdings' P/S remains higher than most other companies in the industry. Generally, our preference is to limit the use of the price-to-sales ratio to establishing what the market thinks about the overall health of a company.
We've established that Star CM Holdings currently trades on a much higher than expected P/S since its recent revenues have been in decline over the medium-term. With a revenue decline on investors' minds, the likelihood of a souring sentiment is quite high which could send the P/S back in line with what we'd expect. Should recent medium-term revenue trends persist, it would pose a significant risk to existing shareholders' investments and prospective investors will have a hard time accepting the current value of the stock.
There are also other vital risk factors to consider and we've discovered 2 warning signs for Star CM Holdings (1 is a bit concerning!) that you should be aware of before investing here.
If companies with solid past earnings growth is up your alley, you may wish to see this free collection of other companies with strong earnings growth and low P/E ratios.
New: Manage All Your Stock Portfolios in One Place
We've created the ultimate portfolio companion for stock investors, and it's free.
• Connect an unlimited number of Portfolios and see your total in one currency
• Be alerted to new Warning Signs or Risks via email or mobile
• Track the Fair Value of your stocks
Have feedback on this article? Concerned about the content? Get in touch with us directly. Alternatively, email editorial-team (at) simplywallst.com.
This article by Simply Wall St is general in nature. We provide commentary based on historical data and analyst forecasts only using an unbiased methodology and our articles are not intended to be financial advice. It does not constitute a recommendation to buy or sell any stock, and does not take account of your objectives, or your financial situation. We aim to bring you long-term focused analysis driven by fundamental data. Note that our analysis may not factor in the latest price-sensitive company announcements or qualitative material. Simply Wall St has no position in any stocks mentioned.
About SEHK:6698
Star CM Holdings
Engages in the production, operation, and licensing of variety programs intellectual properties (IPs) in the People’s Republic of China.
Adequate balance sheet low.
Market Insights

Advertisement
Community Narratives

BMW cruising ahead with new EVs and premium models to boost revenue 5%
Fair Value €135.07|44.6% undervalued
UN
Community Contributor
EU#2 - From Humble Beginnings to Global Powerhouse
Fair Value DKK 851.04|46.4% undervalued
TO
Community Contributor