- Hong Kong
- /
- Entertainment
- /
- SEHK:571
Benign Growth For eSun Holdings Limited (HKG:571) Underpins Stock's 25% Plummet


The eSun Holdings Limited (HKG:571) share price has fared very poorly over the last month, falling by a substantial 25%. Longer-term shareholders will rue the drop in the share price, since it's now virtually flat for the year after a promising few quarters.
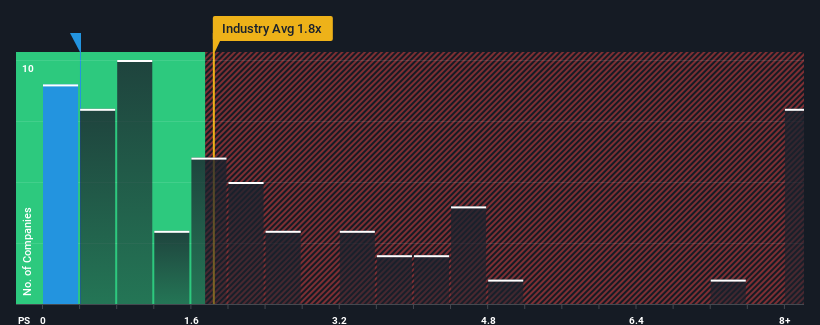
After such a large drop in price, eSun Holdings may be sending bullish signals at the moment with its price-to-sales (or "P/S") ratio of 0.4x, since almost half of all companies in the Entertainment industry in Hong Kong have P/S ratios greater than 1.8x and even P/S higher than 4x are not unusual. Nonetheless, we'd need to dig a little deeper to determine if there is a rational basis for the reduced P/S.
See our latest analysis for eSun Holdings
What Does eSun Holdings' Recent Performance Look Like?
As an illustration, revenue has deteriorated at eSun Holdings over the last year, which is not ideal at all. Perhaps the market believes the recent revenue performance isn't good enough to keep up the industry, causing the P/S ratio to suffer. However, if this doesn't eventuate then existing shareholders may be feeling optimistic about the future direction of the share price.
Although there are no analyst estimates available for eSun Holdings, take a look at this free data-rich visualisation to see how the company stacks up on earnings, revenue and cash flow.How Is eSun Holdings' Revenue Growth Trending?
In order to justify its P/S ratio, eSun Holdings would need to produce sluggish growth that's trailing the industry.
Retrospectively, the last year delivered a frustrating 21% decrease to the company's top line. Regardless, revenue has managed to lift by a handy 19% in aggregate from three years ago, thanks to the earlier period of growth. Although it's been a bumpy ride, it's still fair to say the revenue growth recently has been mostly respectable for the company.
Comparing that to the industry, which is predicted to deliver 50% growth in the next 12 months, the company's momentum is weaker, based on recent medium-term annualised revenue results.
With this information, we can see why eSun Holdings is trading at a P/S lower than the industry. It seems most investors are expecting to see the recent limited growth rates continue into the future and are only willing to pay a reduced amount for the stock.
The Key Takeaway
The southerly movements of eSun Holdings' shares means its P/S is now sitting at a pretty low level. It's argued the price-to-sales ratio is an inferior measure of value within certain industries, but it can be a powerful business sentiment indicator.
Our examination of eSun Holdings confirms that the company's revenue trends over the past three-year years are a key factor in its low price-to-sales ratio, as we suspected, given they fall short of current industry expectations. At this stage investors feel the potential for an improvement in revenue isn't great enough to justify a higher P/S ratio. If recent medium-term revenue trends continue, it's hard to see the share price experience a reversal of fortunes anytime soon.
There are also other vital risk factors to consider and we've discovered 3 warning signs for eSun Holdings (1 is concerning!) that you should be aware of before investing here.
If strong companies turning a profit tickle your fancy, then you'll want to check out this free list of interesting companies that trade on a low P/E (but have proven they can grow earnings).
New: Manage All Your Stock Portfolios in One Place
We've created the ultimate portfolio companion for stock investors, and it's free.
• Connect an unlimited number of Portfolios and see your total in one currency
• Be alerted to new Warning Signs or Risks via email or mobile
• Track the Fair Value of your stocks
Have feedback on this article? Concerned about the content? Get in touch with us directly. Alternatively, email editorial-team (at) simplywallst.com.
This article by Simply Wall St is general in nature. We provide commentary based on historical data and analyst forecasts only using an unbiased methodology and our articles are not intended to be financial advice. It does not constitute a recommendation to buy or sell any stock, and does not take account of your objectives, or your financial situation. We aim to bring you long-term focused analysis driven by fundamental data. Note that our analysis may not factor in the latest price-sensitive company announcements or qualitative material. Simply Wall St has no position in any stocks mentioned.
About SEHK:571
eSun Holdings
An investment holding company, primarily operates in the media and entertainment industry in Hong Kong, Mainland China, and internationally.
Good value with adequate balance sheet.
Market Insights

Community Narratives

