- Hong Kong
- /
- Interactive Media and Services
- /
- SEHK:1753
Duiba Group (HKG:1753) Has Debt But No Earnings; Should You Worry?


Warren Buffett famously said, 'Volatility is far from synonymous with risk.' So it seems the smart money knows that debt - which is usually involved in bankruptcies - is a very important factor, when you assess how risky a company is. We can see that Duiba Group Limited (HKG:1753) does use debt in its business. But the real question is whether this debt is making the company risky.
What Risk Does Debt Bring?
Debt and other liabilities become risky for a business when it cannot easily fulfill those obligations, either with free cash flow or by raising capital at an attractive price. In the worst case scenario, a company can go bankrupt if it cannot pay its creditors. While that is not too common, we often do see indebted companies permanently diluting shareholders because lenders force them to raise capital at a distressed price. Of course, the upside of debt is that it often represents cheap capital, especially when it replaces dilution in a company with the ability to reinvest at high rates of return. When we think about a company's use of debt, we first look at cash and debt together.
See our latest analysis for Duiba Group
What Is Duiba Group's Debt?
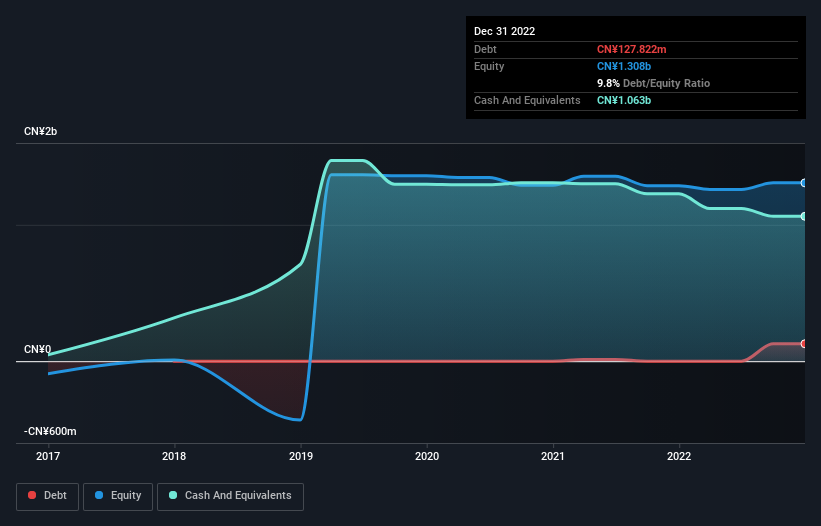
As you can see below, at the end of December 2022, Duiba Group had CN¥127.8m of debt, up from none a year ago. Click the image for more detail. But it also has CN¥1.06b in cash to offset that, meaning it has CN¥934.7m net cash.
How Strong Is Duiba Group's Balance Sheet?
According to the last reported balance sheet, Duiba Group had liabilities of CN¥501.1m due within 12 months, and liabilities of CN¥1.02m due beyond 12 months. Offsetting these obligations, it had cash of CN¥1.06b as well as receivables valued at CN¥257.7m due within 12 months. So it actually has CN¥818.2m more liquid assets than total liabilities.
This surplus liquidity suggests that Duiba Group's balance sheet could take a hit just as well as Homer Simpson's head can take a punch. With this in mind one could posit that its balance sheet means the company is able to handle some adversity. Succinctly put, Duiba Group boasts net cash, so it's fair to say it does not have a heavy debt load! The balance sheet is clearly the area to focus on when you are analysing debt. But it is Duiba Group's earnings that will influence how the balance sheet holds up in the future. So when considering debt, it's definitely worth looking at the earnings trend. Click here for an interactive snapshot.
Over 12 months, Duiba Group reported revenue of CN¥1.6b, which is a gain of 23%, although it did not report any earnings before interest and tax. With any luck the company will be able to grow its way to profitability.
So How Risky Is Duiba Group?
By their very nature companies that are losing money are more risky than those with a long history of profitability. And we do note that Duiba Group had an earnings before interest and tax (EBIT) loss, over the last year. Indeed, in that time it burnt through CN¥177m of cash and made a loss of CN¥46m. Given it only has net cash of CN¥934.7m, the company may need to raise more capital if it doesn't reach break-even soon. With very solid revenue growth in the last year, Duiba Group may be on a path to profitability. Pre-profit companies are often risky, but they can also offer great rewards. When analysing debt levels, the balance sheet is the obvious place to start. However, not all investment risk resides within the balance sheet - far from it. For example - Duiba Group has 1 warning sign we think you should be aware of.
At the end of the day, it's often better to focus on companies that are free from net debt. You can access our special list of such companies (all with a track record of profit growth). It's free.
New: Manage All Your Stock Portfolios in One Place
We've created the ultimate portfolio companion for stock investors, and it's free.
• Connect an unlimited number of Portfolios and see your total in one currency
• Be alerted to new Warning Signs or Risks via email or mobile
• Track the Fair Value of your stocks
Have feedback on this article? Concerned about the content? Get in touch with us directly. Alternatively, email editorial-team (at) simplywallst.com.
This article by Simply Wall St is general in nature. We provide commentary based on historical data and analyst forecasts only using an unbiased methodology and our articles are not intended to be financial advice. It does not constitute a recommendation to buy or sell any stock, and does not take account of your objectives, or your financial situation. We aim to bring you long-term focused analysis driven by fundamental data. Note that our analysis may not factor in the latest price-sensitive company announcements or qualitative material. Simply Wall St has no position in any stocks mentioned.
About SEHK:1753
Duiba Group
An investment holding company, operates as a user management software as a service (SaaS) platform business in Mainland China.
Mediocre balance sheet and slightly overvalued.
Market Insights

Community Narratives

