- Hong Kong
- /
- Interactive Media and Services
- /
- SEHK:150
Hypebeast Limited's (HKG:150) Stock is Soaring But Financials Seem Inconsistent: Will The Uptrend Continue?


Hypebeast's (HKG:150) stock is up by a considerable 14% over the past month. However, we decided to pay attention to the company's fundamentals which don't appear to give a clear sign about the company's financial health. Specifically, we decided to study Hypebeast's ROE in this article.
Return on equity or ROE is a key measure used to assess how efficiently a company's management is utilizing the company's capital. In short, ROE shows the profit each dollar generates with respect to its shareholder investments.
View our latest analysis for Hypebeast
How Do You Calculate Return On Equity?
The formula for return on equity is:
Return on Equity = Net Profit (from continuing operations) ÷ Shareholders' Equity
So, based on the above formula, the ROE for Hypebeast is:
4.6% = HK$22m ÷ HK$480m (Based on the trailing twelve months to March 2024).
The 'return' refers to a company's earnings over the last year. That means that for every HK$1 worth of shareholders' equity, the company generated HK$0.05 in profit.
Why Is ROE Important For Earnings Growth?
So far, we've learned that ROE is a measure of a company's profitability. Based on how much of its profits the company chooses to reinvest or "retain", we are then able to evaluate a company's future ability to generate profits. Assuming all else is equal, companies that have both a higher return on equity and higher profit retention are usually the ones that have a higher growth rate when compared to companies that don't have the same features.
Hypebeast's Earnings Growth And 4.6% ROE
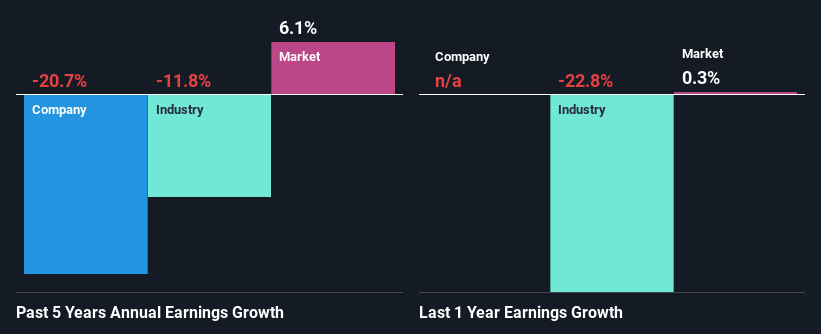
On the face of it, Hypebeast's ROE is not much to talk about. Next, when compared to the average industry ROE of 6.8%, the company's ROE leaves us feeling even less enthusiastic. For this reason, Hypebeast's five year net income decline of 21% is not surprising given its lower ROE. However, there could also be other factors causing the earnings to decline. For instance, the company has a very high payout ratio, or is faced with competitive pressures.
As a next step, we compared Hypebeast's performance with the industry and found thatHypebeast's performance is depressing even when compared with the industry, which has shrunk its earnings at a rate of 12% in the same period, which is a slower than the company.
The basis for attaching value to a company is, to a great extent, tied to its earnings growth. The investor should try to establish if the expected growth or decline in earnings, whichever the case may be, is priced in. This then helps them determine if the stock is placed for a bright or bleak future. One good indicator of expected earnings growth is the P/E ratio which determines the price the market is willing to pay for a stock based on its earnings prospects. So, you may want to check if Hypebeast is trading on a high P/E or a low P/E, relative to its industry.
Is Hypebeast Making Efficient Use Of Its Profits?
In spite of a normal three-year median payout ratio of 33% (that is, a retention ratio of 67%), the fact that Hypebeast's earnings have shrunk is quite puzzling. It looks like there might be some other reasons to explain the lack in that respect. For example, the business could be in decline.
Summary
On the whole, we feel that the performance shown by Hypebeast can be open to many interpretations. While the company does have a high rate of profit retention, its low rate of return is probably hampering its earnings growth. Wrapping up, we would proceed with caution with this company and one way of doing that would be to look at the risk profile of the business. To know the 3 risks we have identified for Hypebeast visit our risks dashboard for free.
Valuation is complex, but we're here to simplify it.
Discover if Hypebeast might be undervalued or overvalued with our detailed analysis, featuring fair value estimates, potential risks, dividends, insider trades, and its financial condition.
Access Free AnalysisHave feedback on this article? Concerned about the content? Get in touch with us directly. Alternatively, email editorial-team (at) simplywallst.com.
This article by Simply Wall St is general in nature. We provide commentary based on historical data and analyst forecasts only using an unbiased methodology and our articles are not intended to be financial advice. It does not constitute a recommendation to buy or sell any stock, and does not take account of your objectives, or your financial situation. We aim to bring you long-term focused analysis driven by fundamental data. Note that our analysis may not factor in the latest price-sensitive company announcements or qualitative material. Simply Wall St has no position in any stocks mentioned.
About SEHK:150
Hypebeast
Through its subsidiaries, operates as a digital media company in Hong Kong, the United States, the People’s Republic of China, and internationally.
Flawless balance sheet and good value.

