
Advertisement
- Hong Kong
- /
- Entertainment
- /
- SEHK:136
A Look At The Intrinsic Value Of China Ruyi Holdings Limited (HKG:136)
Key Insights
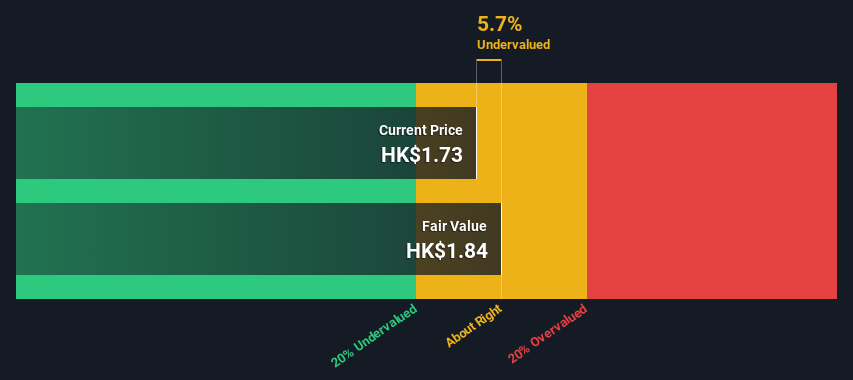
- Using the 2 Stage Free Cash Flow to Equity, China Ruyi Holdings fair value estimate is HK$1.84
- Current share price of HK$1.73 suggests China Ruyi Holdings is potentially trading close to its fair value
- The average premium for China Ruyi Holdings' competitorsis currently 234%
Today we'll do a simple run through of a valuation method used to estimate the attractiveness of China Ruyi Holdings Limited (HKG:136) as an investment opportunity by taking the forecast future cash flows of the company and discounting them back to today's value. We will take advantage of the Discounted Cash Flow (DCF) model for this purpose. Don't get put off by the jargon, the math behind it is actually quite straightforward.
We would caution that there are many ways of valuing a company and, like the DCF, each technique has advantages and disadvantages in certain scenarios. If you want to learn more about discounted cash flow, the rationale behind this calculation can be read in detail in the Simply Wall St analysis model.
View our latest analysis for China Ruyi Holdings
The Method
We are going to use a two-stage DCF model, which, as the name states, takes into account two stages of growth. The first stage is generally a higher growth period which levels off heading towards the terminal value, captured in the second 'steady growth' period. To start off with, we need to estimate the next ten years of cash flows. Seeing as no analyst estimates of free cash flow are available to us, we have extrapolate the previous free cash flow (FCF) from the company's last reported value. We assume companies with shrinking free cash flow will slow their rate of shrinkage, and that companies with growing free cash flow will see their growth rate slow, over this period. We do this to reflect that growth tends to slow more in the early years than it does in later years.
Generally we assume that a dollar today is more valuable than a dollar in the future, and so the sum of these future cash flows is then discounted to today's value:
10-year free cash flow (FCF) estimate
| 2024 | 2025 | 2026 | 2027 | 2028 | 2029 | 2030 | 2031 | 2032 | 2033 | |
| Levered FCF (CN¥, Millions) | CN¥676.9m | CN¥855.0m | CN¥1.02b | CN¥1.16b | CN¥1.28b | CN¥1.38b | CN¥1.46b | CN¥1.53b | CN¥1.59b | CN¥1.65b |
| Growth Rate Estimate Source | Est @ 36.74% | Est @ 26.31% | Est @ 19.01% | Est @ 13.90% | Est @ 10.32% | Est @ 7.81% | Est @ 6.06% | Est @ 4.83% | Est @ 3.97% | Est @ 3.37% |
| Present Value (CN¥, Millions) Discounted @ 8.5% | CN¥624 | CN¥727 | CN¥798 | CN¥838 | CN¥852 | CN¥847 | CN¥828 | CN¥801 | CN¥768 | CN¥732 |
("Est" = FCF growth rate estimated by Simply Wall St)
Present Value of 10-year Cash Flow (PVCF) = CN¥7.8b
After calculating the present value of future cash flows in the initial 10-year period, we need to calculate the Terminal Value, which accounts for all future cash flows beyond the first stage. The Gordon Growth formula is used to calculate Terminal Value at a future annual growth rate equal to the 5-year average of the 10-year government bond yield of 2.0%. We discount the terminal cash flows to today's value at a cost of equity of 8.5%.
Terminal Value (TV)= FCF2033 × (1 + g) ÷ (r – g) = CN¥1.6b× (1 + 2.0%) ÷ (8.5%– 2.0%) = CN¥26b
Present Value of Terminal Value (PVTV)= TV / (1 + r)10= CN¥26b÷ ( 1 + 8.5%)10= CN¥12b
The total value is the sum of cash flows for the next ten years plus the discounted terminal value, which results in the Total Equity Value, which in this case is CN¥19b. In the final step we divide the equity value by the number of shares outstanding. Compared to the current share price of HK$1.7, the company appears about fair value at a 5.7% discount to where the stock price trades currently. Valuations are imprecise instruments though, rather like a telescope - move a few degrees and end up in a different galaxy. Do keep this in mind.
Important Assumptions
Now the most important inputs to a discounted cash flow are the discount rate, and of course, the actual cash flows. Part of investing is coming up with your own evaluation of a company's future performance, so try the calculation yourself and check your own assumptions. The DCF also does not consider the possible cyclicality of an industry, or a company's future capital requirements, so it does not give a full picture of a company's potential performance. Given that we are looking at China Ruyi Holdings as potential shareholders, the cost of equity is used as the discount rate, rather than the cost of capital (or weighted average cost of capital, WACC) which accounts for debt. In this calculation we've used 8.5%, which is based on a levered beta of 1.097. Beta is a measure of a stock's volatility, compared to the market as a whole. We get our beta from the industry average beta of globally comparable companies, with an imposed limit between 0.8 and 2.0, which is a reasonable range for a stable business.
SWOT Analysis for China Ruyi Holdings
Strength
- Debt is not viewed as a risk.
Weakness
- Earnings declined over the past year.
- Shareholders have been diluted in the past year.
Opportunity
- Annual earnings are forecast to grow faster than the Hong Kong market.
- Current share price is below our estimate of fair value.
Threat
- No apparent threats visible for 136.
Moving On:
Whilst important, the DCF calculation shouldn't be the only metric you look at when researching a company. The DCF model is not a perfect stock valuation tool. Preferably you'd apply different cases and assumptions and see how they would impact the company's valuation. For instance, if the terminal value growth rate is adjusted slightly, it can dramatically alter the overall result. For China Ruyi Holdings, we've compiled three essential factors you should further examine:
- Risks: For example, we've discovered 3 warning signs for China Ruyi Holdings that you should be aware of before investing here.
- Future Earnings: How does 136's growth rate compare to its peers and the wider market? Dig deeper into the analyst consensus number for the upcoming years by interacting with our free analyst growth expectation chart.
- Other High Quality Alternatives: Do you like a good all-rounder? Explore our interactive list of high quality stocks to get an idea of what else is out there you may be missing!
PS. The Simply Wall St app conducts a discounted cash flow valuation for every stock on the SEHK every day. If you want to find the calculation for other stocks just search here.
New: AI Stock Screener & Alerts
Our new AI Stock Screener scans the market every day to uncover opportunities.
• Dividend Powerhouses (3%+ Yield)
• Undervalued Small Caps with Insider Buying
• High growth Tech and AI Companies
Or build your own from over 50 metrics.
Have feedback on this article? Concerned about the content? Get in touch with us directly. Alternatively, email editorial-team (at) simplywallst.com.
This article by Simply Wall St is general in nature. We provide commentary based on historical data and analyst forecasts only using an unbiased methodology and our articles are not intended to be financial advice. It does not constitute a recommendation to buy or sell any stock, and does not take account of your objectives, or your financial situation. We aim to bring you long-term focused analysis driven by fundamental data. Note that our analysis may not factor in the latest price-sensitive company announcements or qualitative material. Simply Wall St has no position in any stocks mentioned.
About SEHK:136
China Ruyi Holdings
An investment holding company, engages in content production and online streaming business in the People's Republic of Mainland China, Hong Kong, Europe, and internationally.
Solid track record and good value.
Market Insights

Advertisement
Community Narratives
MicroVision will explode future revenue by 380.37% with a vision towards success
Fair Value US$60.00|98.4% undervalued
TH
Community Contributor
The Indispensable Artery for a New North American Economy
Fair Value CA$132.87|1.3% undervalued
TI
Community Contributor