- Hong Kong
- /
- Entertainment
- /
- SEHK:1022
Market Might Still Lack Some Conviction On Feiyu Technology International Company Ltd. (HKG:1022) Even After 28% Share Price Boost

Feiyu Technology International Company Ltd. (HKG:1022) shares have had a really impressive month, gaining 28% after a shaky period beforehand. The bad news is that even after the stocks recovery in the last 30 days, shareholders are still underwater by about 3.4% over the last year.
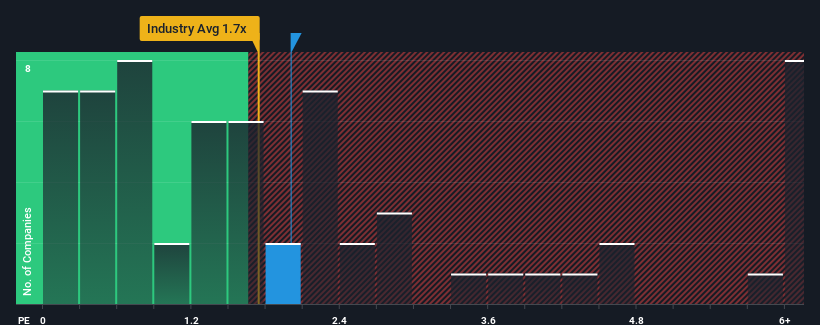
In spite of the firm bounce in price, it's still not a stretch to say that Feiyu Technology International's price-to-sales (or "P/S") ratio of 2x right now seems quite "middle-of-the-road" compared to the Entertainment industry in Hong Kong, where the median P/S ratio is around 1.7x. While this might not raise any eyebrows, if the P/S ratio is not justified investors could be missing out on a potential opportunity or ignoring looming disappointment.
Check out our latest analysis for Feiyu Technology International
What Does Feiyu Technology International's Recent Performance Look Like?
Revenue has risen firmly for Feiyu Technology International recently, which is pleasing to see. One possibility is that the P/S is moderate because investors think this respectable revenue growth might not be enough to outperform the broader industry in the near future. Those who are bullish on Feiyu Technology International will be hoping that this isn't the case, so that they can pick up the stock at a lower valuation.
Want the full picture on earnings, revenue and cash flow for the company? Then our free report on Feiyu Technology International will help you shine a light on its historical performance.Do Revenue Forecasts Match The P/S Ratio?
Feiyu Technology International's P/S ratio would be typical for a company that's only expected to deliver moderate growth, and importantly, perform in line with the industry.
Retrospectively, the last year delivered an exceptional 18% gain to the company's top line. The latest three year period has also seen an excellent 93% overall rise in revenue, aided by its short-term performance. So we can start by confirming that the company has done a great job of growing revenue over that time.
This is in contrast to the rest of the industry, which is expected to grow by 20% over the next year, materially lower than the company's recent medium-term annualised growth rates.
In light of this, it's curious that Feiyu Technology International's P/S sits in line with the majority of other companies. It may be that most investors are not convinced the company can maintain its recent growth rates.
The Final Word
Feiyu Technology International's stock has a lot of momentum behind it lately, which has brought its P/S level with the rest of the industry. Generally, our preference is to limit the use of the price-to-sales ratio to establishing what the market thinks about the overall health of a company.
To our surprise, Feiyu Technology International revealed its three-year revenue trends aren't contributing to its P/S as much as we would have predicted, given they look better than current industry expectations. It'd be fair to assume that potential risks the company faces could be the contributing factor to the lower than expected P/S. It appears some are indeed anticipating revenue instability, because the persistence of these recent medium-term conditions would normally provide a boost to the share price.
Don't forget that there may be other risks. For instance, we've identified 1 warning sign for Feiyu Technology International that you should be aware of.
If these risks are making you reconsider your opinion on Feiyu Technology International, explore our interactive list of high quality stocks to get an idea of what else is out there.
Mobile Infrastructure for Defense and Disaster
The next wave in robotics isn't humanoid. Its fully autonomous towers delivering 5G, ISR, and radar in under 30 minutes, anywhere.
Get the investor briefing before the next round of contracts
Sponsored On Behalf of CiTechNew: AI Stock Screener & Alerts
Our new AI Stock Screener scans the market every day to uncover opportunities.
• Dividend Powerhouses (3%+ Yield)
• Undervalued Small Caps with Insider Buying
• High growth Tech and AI Companies
Or build your own from over 50 metrics.
Have feedback on this article? Concerned about the content? Get in touch with us directly. Alternatively, email editorial-team (at) simplywallst.com.
This article by Simply Wall St is general in nature. We provide commentary based on historical data and analyst forecasts only using an unbiased methodology and our articles are not intended to be financial advice. It does not constitute a recommendation to buy or sell any stock, and does not take account of your objectives, or your financial situation. We aim to bring you long-term focused analysis driven by fundamental data. Note that our analysis may not factor in the latest price-sensitive company announcements or qualitative material. Simply Wall St has no position in any stocks mentioned.
About SEHK:1022
Feiyu Technology International
An investment holding company, engages in the development, operation, and distribution of various games in Mainland China.
Flawless balance sheet with proven track record.
Market Insights

Weekly Picks

Early mover in a fast growing industry. Likely to experience share price volatility as they scale


A case for CA$31.80 (undiluted), aka 8,616% upside from CA$0.37 (an 86 bagger!).


Moderation and Stabilisation: HOLD: Fair Price based on a 4-year Cycle is $12.08
Recently Updated Narratives

Airbnb Stock: Platform Growth in a World of Saturation and Scrutiny

Adobe Stock: AI-Fueled ARR Growth Pushes Guidance Higher, But Cost Pressures Loom

Thomson Reuters Stock: When Legal Intelligence Becomes Mission-Critical Infrastructure
Popular Narratives


Crazy Undervalued 42 Baggers Silver Play (Active & Running Mine)


NVDA: Expanding AI Demand Will Drive Major Data Center Investments Through 2026

The AI Infrastructure Giant Grows Into Its Valuation
Trending Discussion


