The five-year loss for Yusei Holdings (HKG:96) shareholders likely driven by its shrinking earnings


It is doubtless a positive to see that the Yusei Holdings Limited (HKG:96) share price has gained some 57% in the last three months. But that doesn't change the fact that the returns over the last half decade have been disappointing. In that time the share price has delivered a rude shock to holders, who find themselves down 56% after a long stretch. So we're not so sure if the recent bounce should be celebrated. We'd err towards caution given the long term under-performance.
On a more encouraging note the company has added HK$45m to its market cap in just the last 7 days, so let's see if we can determine what's driven the five-year loss for shareholders.
See our latest analysis for Yusei Holdings
While the efficient markets hypothesis continues to be taught by some, it has been proven that markets are over-reactive dynamic systems, and investors are not always rational. One flawed but reasonable way to assess how sentiment around a company has changed is to compare the earnings per share (EPS) with the share price.
Looking back five years, both Yusei Holdings' share price and EPS declined; the latter at a rate of 4.0% per year. This reduction in EPS is less than the 15% annual reduction in the share price. So it seems the market was too confident about the business, in the past. The low P/E ratio of 4.92 further reflects this reticence.
The graphic below depicts how EPS has changed over time (unveil the exact values by clicking on the image).
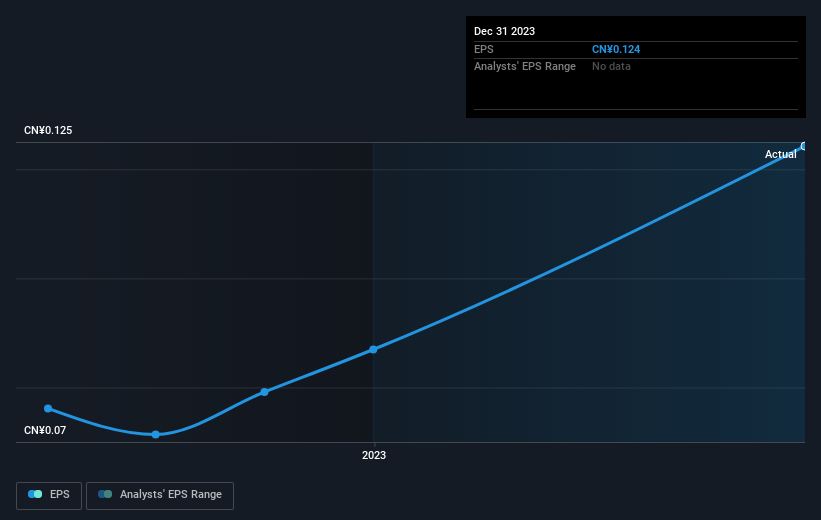
Dive deeper into Yusei Holdings' key metrics by checking this interactive graph of Yusei Holdings's earnings, revenue and cash flow.
What About Dividends?
As well as measuring the share price return, investors should also consider the total shareholder return (TSR). The TSR is a return calculation that accounts for the value of cash dividends (assuming that any dividend received was reinvested) and the calculated value of any discounted capital raisings and spin-offs. So for companies that pay a generous dividend, the TSR is often a lot higher than the share price return. We note that for Yusei Holdings the TSR over the last 5 years was -52%, which is better than the share price return mentioned above. This is largely a result of its dividend payments!
A Different Perspective
It's nice to see that Yusei Holdings shareholders have received a total shareholder return of 17% over the last year. And that does include the dividend. Notably the five-year annualised TSR loss of 9% per year compares very unfavourably with the recent share price performance. This makes us a little wary, but the business might have turned around its fortunes. I find it very interesting to look at share price over the long term as a proxy for business performance. But to truly gain insight, we need to consider other information, too. For instance, we've identified 4 warning signs for Yusei Holdings (3 are significant) that you should be aware of.
If you like to buy stocks alongside management, then you might just love this free list of companies. (Hint: many of them are unnoticed AND have attractive valuation).
Please note, the market returns quoted in this article reflect the market weighted average returns of stocks that currently trade on Hong Kong exchanges.
New: Manage All Your Stock Portfolios in One Place
We've created the ultimate portfolio companion for stock investors, and it's free.
• Connect an unlimited number of Portfolios and see your total in one currency
• Be alerted to new Warning Signs or Risks via email or mobile
• Track the Fair Value of your stocks
Have feedback on this article? Concerned about the content? Get in touch with us directly. Alternatively, email editorial-team (at) simplywallst.com.
This article by Simply Wall St is general in nature. We provide commentary based on historical data and analyst forecasts only using an unbiased methodology and our articles are not intended to be financial advice. It does not constitute a recommendation to buy or sell any stock, and does not take account of your objectives, or your financial situation. We aim to bring you long-term focused analysis driven by fundamental data. Note that our analysis may not factor in the latest price-sensitive company announcements or qualitative material. Simply Wall St has no position in any stocks mentioned.
About SEHK:96
Yusei Holdings
An investment holding company, primarily engages in the design, development, and fabrication of precision plastic injection moulds in the People’s Republic of China.
Good value with proven track record.
