
Advertisement
- Hong Kong
- /
- Metals and Mining
- /
- SEHK:826
Here's What To Make Of Tiangong International's (HKG:826) Decelerating Rates Of Return
What trends should we look for it we want to identify stocks that can multiply in value over the long term? One common approach is to try and find a company with returns on capital employed (ROCE) that are increasing, in conjunction with a growing amount of capital employed. Put simply, these types of businesses are compounding machines, meaning they are continually reinvesting their earnings at ever-higher rates of return. Although, when we looked at Tiangong International (HKG:826), it didn't seem to tick all of these boxes.
What Is Return On Capital Employed (ROCE)?
For those that aren't sure what ROCE is, it measures the amount of pre-tax profits a company can generate from the capital employed in its business. To calculate this metric for Tiangong International, this is the formula:
Return on Capital Employed = Earnings Before Interest and Tax (EBIT) ÷ (Total Assets - Current Liabilities)
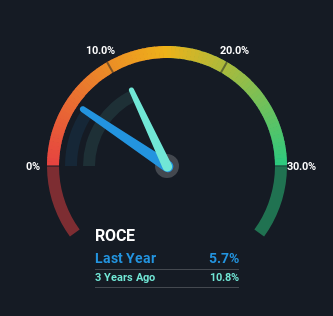
0.057 = CN¥456m ÷ (CN¥14b - CN¥6.3b) (Based on the trailing twelve months to June 2023).
Therefore, Tiangong International has an ROCE of 5.7%. In absolute terms, that's a low return and it also under-performs the Metals and Mining industry average of 8.4%.
View our latest analysis for Tiangong International
In the above chart we have measured Tiangong International's prior ROCE against its prior performance, but the future is arguably more important. If you're interested, you can view the analysts predictions in our free report on analyst forecasts for the company.
The Trend Of ROCE
In terms of Tiangong International's historical ROCE trend, it doesn't exactly demand attention. The company has employed 49% more capital in the last five years, and the returns on that capital have remained stable at 5.7%. This poor ROCE doesn't inspire confidence right now, and with the increase in capital employed, it's evident that the business isn't deploying the funds into high return investments.
Another thing to note, Tiangong International has a high ratio of current liabilities to total assets of 44%. This effectively means that suppliers (or short-term creditors) are funding a large portion of the business, so just be aware that this can introduce some elements of risk. While it's not necessarily a bad thing, it can be beneficial if this ratio is lower.
Our Take On Tiangong International's ROCE
As we've seen above, Tiangong International's returns on capital haven't increased but it is reinvesting in the business. And investors may be recognizing these trends since the stock has only returned a total of 39% to shareholders over the last five years. So if you're looking for a multi-bagger, the underlying trends indicate you may have better chances elsewhere.
Tiangong International could be trading at an attractive price in other respects, so you might find our free intrinsic value estimation on our platform quite valuable.
While Tiangong International isn't earning the highest return, check out this free list of companies that are earning high returns on equity with solid balance sheets.
Valuation is complex, but we're here to simplify it.
Discover if Tiangong International might be undervalued or overvalued with our detailed analysis, featuring fair value estimates, potential risks, dividends, insider trades, and its financial condition.
Access Free AnalysisHave feedback on this article? Concerned about the content? Get in touch with us directly. Alternatively, email editorial-team (at) simplywallst.com.
This article by Simply Wall St is general in nature. We provide commentary based on historical data and analyst forecasts only using an unbiased methodology and our articles are not intended to be financial advice. It does not constitute a recommendation to buy or sell any stock, and does not take account of your objectives, or your financial situation. We aim to bring you long-term focused analysis driven by fundamental data. Note that our analysis may not factor in the latest price-sensitive company announcements or qualitative material. Simply Wall St has no position in any stocks mentioned.
About SEHK:826
Tiangong International
Manufactures and sells alloy steel, cutting tools, titanium alloys, and related products.
Reasonable growth potential with adequate balance sheet.
Market Insights

Advertisement
Community Narratives
Kodiak AI - a potential 100 bagger opportunity?
Fair Value US$14.00|40.6% undervalued
DA
Community Contributor
A Fair Price for a Great Business Facing Real Threats
Fair Value US$383.06|10.4% undervalued
IM
Community Contributor
AXON And Shopify Integration Will Unlock Global Mobile Advertising
Fair Value US$646.30|12.4% undervalued
AN
Based on Analyst Price Targets