
Advertisement
Come Sure Group (Holdings) Limited (HKG:794) Held Back By Insufficient Growth Even After Shares Climb 55%
Come Sure Group (Holdings) Limited (HKG:794) shareholders would be excited to see that the share price has had a great month, posting a 55% gain and recovering from prior weakness. Unfortunately, the gains of the last month did little to right the losses of the last year with the stock still down 11% over that time.
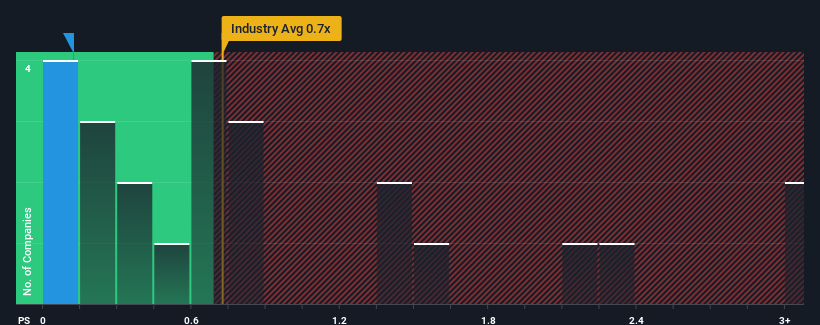
Even after such a large jump in price, when close to half the companies operating in Hong Kong's Packaging industry have price-to-sales ratios (or "P/S") above 0.7x, you may still consider Come Sure Group (Holdings) as an enticing stock to check out with its 0.1x P/S ratio. Nonetheless, we'd need to dig a little deeper to determine if there is a rational basis for the reduced P/S.
View our latest analysis for Come Sure Group (Holdings)
How Come Sure Group (Holdings) Has Been Performing
For example, consider that Come Sure Group (Holdings)'s financial performance has been poor lately as its revenue has been in decline. Perhaps the market believes the recent revenue performance isn't good enough to keep up the industry, causing the P/S ratio to suffer. If you like the company, you'd be hoping this isn't the case so that you could potentially pick up some stock while it's out of favour.
We don't have analyst forecasts, but you can see how recent trends are setting up the company for the future by checking out our free report on Come Sure Group (Holdings)'s earnings, revenue and cash flow.How Is Come Sure Group (Holdings)'s Revenue Growth Trending?
The only time you'd be truly comfortable seeing a P/S as low as Come Sure Group (Holdings)'s is when the company's growth is on track to lag the industry.
In reviewing the last year of financials, we were disheartened to see the company's revenues fell to the tune of 32%. The last three years don't look nice either as the company has shrunk revenue by 32% in aggregate. Therefore, it's fair to say the revenue growth recently has been undesirable for the company.
Weighing that medium-term revenue trajectory against the broader industry's one-year forecast for expansion of 20% shows it's an unpleasant look.
With this in mind, we understand why Come Sure Group (Holdings)'s P/S is lower than most of its industry peers. Nonetheless, there's no guarantee the P/S has reached a floor yet with revenue going in reverse. Even just maintaining these prices could be difficult to achieve as recent revenue trends are already weighing down the shares.
What Does Come Sure Group (Holdings)'s P/S Mean For Investors?
Despite Come Sure Group (Holdings)'s share price climbing recently, its P/S still lags most other companies. It's argued the price-to-sales ratio is an inferior measure of value within certain industries, but it can be a powerful business sentiment indicator.
Our examination of Come Sure Group (Holdings) confirms that the company's shrinking revenue over the past medium-term is a key factor in its low price-to-sales ratio, given the industry is projected to grow. At this stage investors feel the potential for an improvement in revenue isn't great enough to justify a higher P/S ratio. Given the current circumstances, it seems unlikely that the share price will experience any significant movement in either direction in the near future if recent medium-term revenue trends persist.
You should always think about risks. Case in point, we've spotted 3 warning signs for Come Sure Group (Holdings) you should be aware of, and 2 of them are concerning.
It's important to make sure you look for a great company, not just the first idea you come across. So if growing profitability aligns with your idea of a great company, take a peek at this free list of interesting companies with strong recent earnings growth (and a low P/E).
New: AI Stock Screener & Alerts
Our new AI Stock Screener scans the market every day to uncover opportunities.
• Dividend Powerhouses (3%+ Yield)
• Undervalued Small Caps with Insider Buying
• High growth Tech and AI Companies
Or build your own from over 50 metrics.
Have feedback on this article? Concerned about the content? Get in touch with us directly. Alternatively, email editorial-team (at) simplywallst.com.
This article by Simply Wall St is general in nature. We provide commentary based on historical data and analyst forecasts only using an unbiased methodology and our articles are not intended to be financial advice. It does not constitute a recommendation to buy or sell any stock, and does not take account of your objectives, or your financial situation. We aim to bring you long-term focused analysis driven by fundamental data. Note that our analysis may not factor in the latest price-sensitive company announcements or qualitative material. Simply Wall St has no position in any stocks mentioned.
About SEHK:794
Come Sure Group (Holdings)
An investment holding company, engages in the manufacture, sale, and trading of corrugated paperboards and paper-based packaging products in Hong Kong, Macau, and the People’s Republic of China.
Adequate balance sheet with low risk.
Similar Companies
Market Insights

Advertisement
Community Narratives
MINISO's fair value is projected at 26.69 with an anticipated PE ratio shift of 20x
Fair Value US$24.03|11.0% undervalued
BE
Community Contributor
Procter & Gamble: A Dividend Giant Facing Slowing Growth
Fair Value US$119.81|23.3% overvalued
AN
Community Contributor
Eli Lilly's Future Growth Driven by Tirzepatide and Favorable Market Conditions
Fair Value US$1.19k|13.8% undervalued
EA
Community Contributor