- Hong Kong
- /
- Metals and Mining
- /
- SEHK:639
Did You Participate In Any Of Shougang Fushan Resources Group's (HKG:639) Fantastic 194% Return ?


Generally speaking the aim of active stock picking is to find companies that provide returns that are superior to the market average. Buying under-rated businesses is one path to excess returns. For example, long term Shougang Fushan Resources Group Limited (HKG:639) shareholders have enjoyed a 79% share price rise over the last half decade, well in excess of the market return of around 8.5% (not including dividends). However, more recent returns haven't been as impressive as that, with the stock returning just 20% in the last year , including dividends .
See our latest analysis for Shougang Fushan Resources Group
While markets are a powerful pricing mechanism, share prices reflect investor sentiment, not just underlying business performance. By comparing earnings per share (EPS) and share price changes over time, we can get a feel for how investor attitudes to a company have morphed over time.
During the last half decade, Shougang Fushan Resources Group became profitable. That would generally be considered a positive, so we'd expect the share price to be up.
The company's earnings per share (over time) is depicted in the image below (click to see the exact numbers).
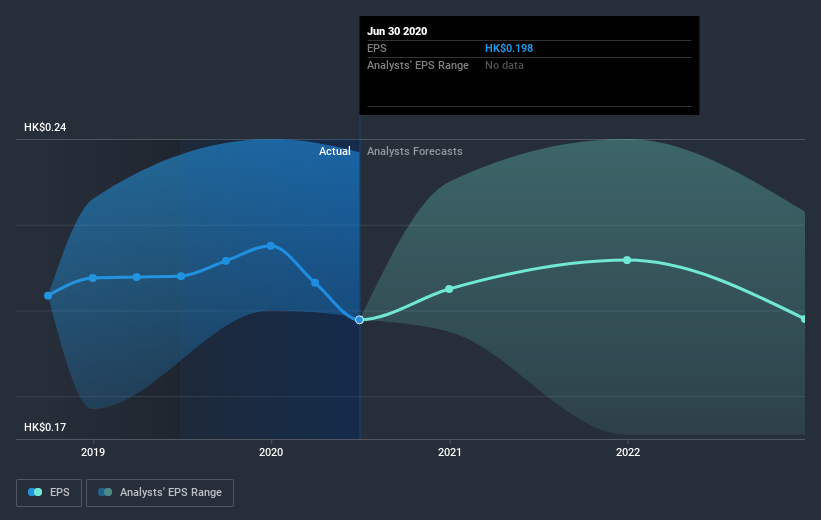
It's probably worth noting that the CEO is paid less than the median at similar sized companies. It's always worth keeping an eye on CEO pay, but a more important question is whether the company will grow earnings throughout the years. Before buying or selling a stock, we always recommend a close examination of historic growth trends, available here..
What About Dividends?
When looking at investment returns, it is important to consider the difference between total shareholder return (TSR) and share price return. Whereas the share price return only reflects the change in the share price, the TSR includes the value of dividends (assuming they were reinvested) and the benefit of any discounted capital raising or spin-off. It's fair to say that the TSR gives a more complete picture for stocks that pay a dividend. As it happens, Shougang Fushan Resources Group's TSR for the last 5 years was 194%, which exceeds the share price return mentioned earlier. This is largely a result of its dividend payments!
A Different Perspective
We're pleased to report that Shougang Fushan Resources Group shareholders have received a total shareholder return of 20% over one year. Of course, that includes the dividend. However, the TSR over five years, coming in at 24% per year, is even more impressive. It's always interesting to track share price performance over the longer term. But to understand Shougang Fushan Resources Group better, we need to consider many other factors. Take risks, for example - Shougang Fushan Resources Group has 2 warning signs (and 1 which shouldn't be ignored) we think you should know about.
We will like Shougang Fushan Resources Group better if we see some big insider buys. While we wait, check out this free list of growing companies with considerable, recent, insider buying.
Please note, the market returns quoted in this article reflect the market weighted average returns of stocks that currently trade on HK exchanges.
When trading Shougang Fushan Resources Group or any other investment, use the platform considered by many to be the Professional's Gateway to the Worlds Market, Interactive Brokers. You get the lowest-cost* trading on stocks, options, futures, forex, bonds and funds worldwide from a single integrated account. Promoted
New: Manage All Your Stock Portfolios in One Place
We've created the ultimate portfolio companion for stock investors, and it's free.
• Connect an unlimited number of Portfolios and see your total in one currency
• Be alerted to new Warning Signs or Risks via email or mobile
• Track the Fair Value of your stocks
This article by Simply Wall St is general in nature. It does not constitute a recommendation to buy or sell any stock, and does not take account of your objectives, or your financial situation. We aim to bring you long-term focused analysis driven by fundamental data. Note that our analysis may not factor in the latest price-sensitive company announcements or qualitative material. Simply Wall St has no position in any stocks mentioned.
*Interactive Brokers Rated Lowest Cost Broker by StockBrokers.com Annual Online Review 2020
Have feedback on this article? Concerned about the content? Get in touch with us directly. Alternatively, email editorial-team@simplywallst.com.
About SEHK:639
Shougang Fushan Resources Group
An investment holding company, engages in the business of coking coal mining and production and sales of coking coal products in the People's Republic of China.
Flawless balance sheet, good value and pays a dividend.
Similar Companies
Market Insights

Community Narratives

