- Hong Kong
- /
- Metals and Mining
- /
- SEHK:2362
Some Jinchuan Group International Resources Co. Ltd (HKG:2362) Shareholders Look For Exit As Shares Take 29% Pounding
Jinchuan Group International Resources Co. Ltd (HKG:2362) shareholders won't be pleased to see that the share price has had a very rough month, dropping 29% and undoing the prior period's positive performance. Still, a bad month hasn't completely ruined the past year with the stock gaining 45%, which is great even in a bull market.
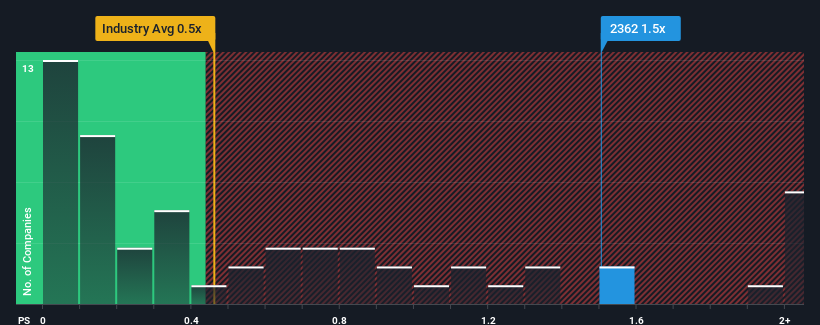
Even after such a large drop in price, given close to half the companies operating in Hong Kong's Metals and Mining industry have price-to-sales ratios (or "P/S") below 0.5x, you may still consider Jinchuan Group International Resources as a stock to potentially avoid with its 1.5x P/S ratio. Nonetheless, we'd need to dig a little deeper to determine if there is a rational basis for the elevated P/S.
View our latest analysis for Jinchuan Group International Resources

How Jinchuan Group International Resources Has Been Performing
As an illustration, revenue has deteriorated at Jinchuan Group International Resources over the last year, which is not ideal at all. Perhaps the market believes the company can do enough to outperform the rest of the industry in the near future, which is keeping the P/S ratio high. You'd really hope so, otherwise you're paying a pretty hefty price for no particular reason.
We don't have analyst forecasts, but you can see how recent trends are setting up the company for the future by checking out our free report on Jinchuan Group International Resources' earnings, revenue and cash flow.Do Revenue Forecasts Match The High P/S Ratio?
There's an inherent assumption that a company should outperform the industry for P/S ratios like Jinchuan Group International Resources' to be considered reasonable.
In reviewing the last year of financials, we were disheartened to see the company's revenues fell to the tune of 28%. That put a dampener on the good run it was having over the longer-term as its three-year revenue growth is still a noteworthy 20% in total. Although it's been a bumpy ride, it's still fair to say the revenue growth recently has been mostly respectable for the company.
Comparing that to the industry, which is predicted to deliver 14% growth in the next 12 months, the company's momentum is weaker, based on recent medium-term annualised revenue results.
In light of this, it's alarming that Jinchuan Group International Resources' P/S sits above the majority of other companies. It seems most investors are ignoring the fairly limited recent growth rates and are hoping for a turnaround in the company's business prospects. Only the boldest would assume these prices are sustainable as a continuation of recent revenue trends is likely to weigh heavily on the share price eventually.
What We Can Learn From Jinchuan Group International Resources' P/S?
Jinchuan Group International Resources' P/S remain high even after its stock plunged. It's argued the price-to-sales ratio is an inferior measure of value within certain industries, but it can be a powerful business sentiment indicator.
The fact that Jinchuan Group International Resources currently trades on a higher P/S relative to the industry is an oddity, since its recent three-year growth is lower than the wider industry forecast. When we see slower than industry revenue growth but an elevated P/S, there's considerable risk of the share price declining, sending the P/S lower. Unless there is a significant improvement in the company's medium-term performance, it will be difficult to prevent the P/S ratio from declining to a more reasonable level.
And what about other risks? Every company has them, and we've spotted 3 warning signs for Jinchuan Group International Resources (of which 2 can't be ignored!) you should know about.
If you're unsure about the strength of Jinchuan Group International Resources' business, why not explore our interactive list of stocks with solid business fundamentals for some other companies you may have missed.
New: Manage All Your Stock Portfolios in One Place
We've created the ultimate portfolio companion for stock investors, and it's free.
• Connect an unlimited number of Portfolios and see your total in one currency
• Be alerted to new Warning Signs or Risks via email or mobile
• Track the Fair Value of your stocks
Have feedback on this article? Concerned about the content? Get in touch with us directly. Alternatively, email editorial-team (at) simplywallst.com.
This article by Simply Wall St is general in nature. We provide commentary based on historical data and analyst forecasts only using an unbiased methodology and our articles are not intended to be financial advice. It does not constitute a recommendation to buy or sell any stock, and does not take account of your objectives, or your financial situation. We aim to bring you long-term focused analysis driven by fundamental data. Note that our analysis may not factor in the latest price-sensitive company announcements or qualitative material. Simply Wall St has no position in any stocks mentioned.
Have feedback on this article? Concerned about the content? Get in touch with us directly. Alternatively, email editorial-team@simplywallst.com
About SEHK:2362
Jinchuan Group International Resources
Jinchuan Group International Resources Co.
Mediocre balance sheet low.
Market Insights
Community Narratives


Recently Updated Narratives

Astor Enerji will surge with a fair value of $140.43 in the next 3 years

Proximus: The State-Backed Backup Plan with 7% Gross Yield and 15% Currency Upside.

CEO: We are winners in the long term in the AI world
Popular Narratives


MicroVision will explode future revenue by 380.37% with a vision towards success


The company that turned a verb into a global necessity and basically runs the modern internet, digital ads, smartphones, maps, and AI.


