
Advertisement
What Pan Asia Data Holdings Inc.'s (HKG:1561) 32% Share Price Gain Is Not Telling You
Pan Asia Data Holdings Inc. (HKG:1561) shareholders have had their patience rewarded with a 32% share price jump in the last month. Still, the 30-day jump doesn't change the fact that longer term shareholders have seen their stock decimated by the 80% share price drop in the last twelve months.
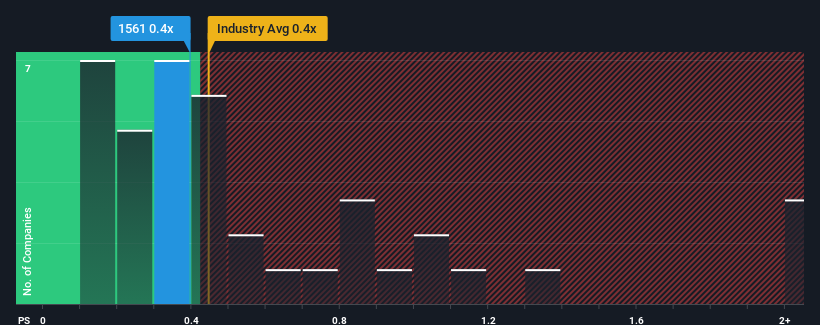
Even after such a large jump in price, you could still be forgiven for feeling indifferent about Pan Asia Data Holdings' P/S ratio of 0.4x, since the median price-to-sales (or "P/S") ratio for the Chemicals industry in Hong Kong is about the same. While this might not raise any eyebrows, if the P/S ratio is not justified investors could be missing out on a potential opportunity or ignoring looming disappointment.
See our latest analysis for Pan Asia Data Holdings
What Does Pan Asia Data Holdings' Recent Performance Look Like?
The revenue growth achieved at Pan Asia Data Holdings over the last year would be more than acceptable for most companies. Perhaps the market is expecting future revenue performance to only keep up with the broader industry, which has keeping the P/S in line with expectations. Those who are bullish on Pan Asia Data Holdings will be hoping that this isn't the case, so that they can pick up the stock at a lower valuation.
Want the full picture on earnings, revenue and cash flow for the company? Then our free report on Pan Asia Data Holdings will help you shine a light on its historical performance.What Are Revenue Growth Metrics Telling Us About The P/S?
There's an inherent assumption that a company should be matching the industry for P/S ratios like Pan Asia Data Holdings' to be considered reasonable.
If we review the last year of revenue growth, the company posted a terrific increase of 28%. Despite this strong recent growth, it's still struggling to catch up as its three-year revenue frustratingly shrank by 9.4% overall. Therefore, it's fair to say the revenue growth recently has been undesirable for the company.
In contrast to the company, the rest of the industry is expected to grow by 35% over the next year, which really puts the company's recent medium-term revenue decline into perspective.
With this in mind, we find it worrying that Pan Asia Data Holdings' P/S exceeds that of its industry peers. It seems most investors are ignoring the recent poor growth rate and are hoping for a turnaround in the company's business prospects. Only the boldest would assume these prices are sustainable as a continuation of recent revenue trends is likely to weigh on the share price eventually.
The Bottom Line On Pan Asia Data Holdings' P/S
Its shares have lifted substantially and now Pan Asia Data Holdings' P/S is back within range of the industry median. While the price-to-sales ratio shouldn't be the defining factor in whether you buy a stock or not, it's quite a capable barometer of revenue expectations.
Our look at Pan Asia Data Holdings revealed its shrinking revenues over the medium-term haven't impacted the P/S as much as we anticipated, given the industry is set to grow. Even though it matches the industry, we're uncomfortable with the current P/S ratio, as this dismal revenue performance is unlikely to support a more positive sentiment for long. If recent medium-term revenue trends continue, it will place shareholders' investments at risk and potential investors in danger of paying an unnecessary premium.
It is also worth noting that we have found 4 warning signs for Pan Asia Data Holdings (1 is concerning!) that you need to take into consideration.
If strong companies turning a profit tickle your fancy, then you'll want to check out this free list of interesting companies that trade on a low P/E (but have proven they can grow earnings).
New: Manage All Your Stock Portfolios in One Place
We've created the ultimate portfolio companion for stock investors, and it's free.
• Connect an unlimited number of Portfolios and see your total in one currency
• Be alerted to new Warning Signs or Risks via email or mobile
• Track the Fair Value of your stocks
Have feedback on this article? Concerned about the content? Get in touch with us directly. Alternatively, email editorial-team (at) simplywallst.com.
This article by Simply Wall St is general in nature. We provide commentary based on historical data and analyst forecasts only using an unbiased methodology and our articles are not intended to be financial advice. It does not constitute a recommendation to buy or sell any stock, and does not take account of your objectives, or your financial situation. We aim to bring you long-term focused analysis driven by fundamental data. Note that our analysis may not factor in the latest price-sensitive company announcements or qualitative material. Simply Wall St has no position in any stocks mentioned.
About SEHK:1561
Pan Asia Data Holdings
An investment holding company, engages in the provision of big data and third-party payment services in the People’s Republic of China and internationally.
Slight risk and slightly overvalued.
Market Insights

Advertisement
Community Narratives
Kodiak AI - a potential 100 bagger opportunity?
Fair Value US$14.00|44.7% undervalued
DA
Community Contributor
A Fair Price for a Great Business Facing Real Threats
Fair Value US$383.06|13.0% undervalued
IM
Community Contributor
AXON And Shopify Integration Will Unlock Global Mobile Advertising
Fair Value US$646.30|0% overvalued
AN
Based on Analyst Price Targets