
Advertisement
- Hong Kong
- /
- Metals and Mining
- /
- SEHK:103
What Type Of Returns Would Shougang Concord Century Holdings'(HKG:103) Shareholders Have Earned If They Purchased Their SharesFive Years Ago?
Ideally, your overall portfolio should beat the market average. But in any portfolio, there will be mixed results between individual stocks. At this point some shareholders may be questioning their investment in Shougang Concord Century Holdings Limited (HKG:103), since the last five years saw the share price fall 16%.
See our latest analysis for Shougang Concord Century Holdings
To paraphrase Benjamin Graham: Over the short term the market is a voting machine, but over the long term it's a weighing machine. By comparing earnings per share (EPS) and share price changes over time, we can get a feel for how investor attitudes to a company have morphed over time.
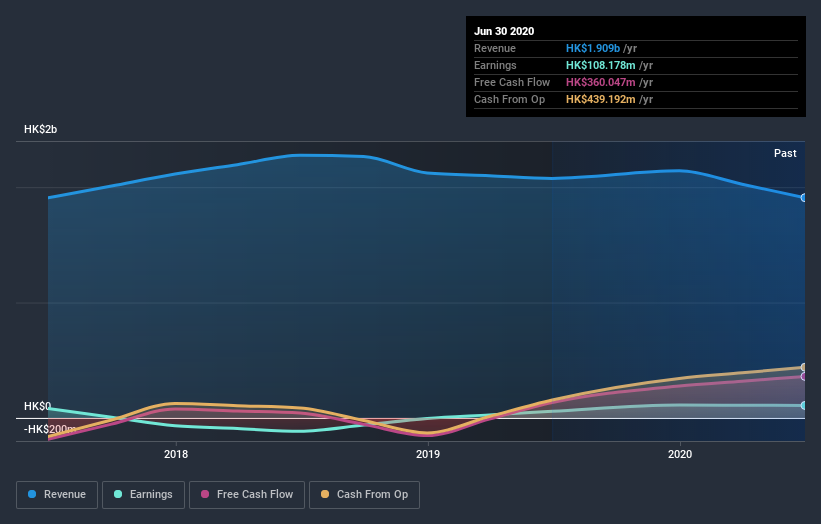
Shougang Concord Century Holdings became profitable within the last five years. Most would consider that to be a good thing, so it's counter-intuitive to see the share price declining. Other metrics might give us a better handle on how its value is changing over time.
We note that the dividend has remained healthy, so that wouldn't really explain the share price drop. While it's not completely obvious why the share price is down, a closer look at the company's history might help explain it.
You can see how earnings and revenue have changed over time in the image below (click on the chart to see the exact values).
If you are thinking of buying or selling Shougang Concord Century Holdings stock, you should check out this FREE detailed report on its balance sheet.
What About Dividends?
As well as measuring the share price return, investors should also consider the total shareholder return (TSR). The TSR is a return calculation that accounts for the value of cash dividends (assuming that any dividend received was reinvested) and the calculated value of any discounted capital raisings and spin-offs. It's fair to say that the TSR gives a more complete picture for stocks that pay a dividend. As it happens, Shougang Concord Century Holdings' TSR for the last 5 years was -12%, which exceeds the share price return mentioned earlier. And there's no prize for guessing that the dividend payments largely explain the divergence!
A Different Perspective
It's nice to see that Shougang Concord Century Holdings shareholders have received a total shareholder return of 16% over the last year. Of course, that includes the dividend. There's no doubt those recent returns are much better than the TSR loss of 2% per year over five years. We generally put more weight on the long term performance over the short term, but the recent improvement could hint at a (positive) inflection point within the business. I find it very interesting to look at share price over the long term as a proxy for business performance. But to truly gain insight, we need to consider other information, too. Consider risks, for instance. Every company has them, and we've spotted 3 warning signs for Shougang Concord Century Holdings you should know about.
Of course, you might find a fantastic investment by looking elsewhere. So take a peek at this free list of companies we expect will grow earnings.
Please note, the market returns quoted in this article reflect the market weighted average returns of stocks that currently trade on HK exchanges.
If you’re looking to trade Shougang Concord Century Holdings, open an account with the lowest-cost* platform trusted by professionals, Interactive Brokers. Their clients from over 200 countries and territories trade stocks, options, futures, forex, bonds and funds worldwide from a single integrated account. Promoted
New: Manage All Your Stock Portfolios in One Place
We've created the ultimate portfolio companion for stock investors, and it's free.
• Connect an unlimited number of Portfolios and see your total in one currency
• Be alerted to new Warning Signs or Risks via email or mobile
• Track the Fair Value of your stocks
This article by Simply Wall St is general in nature. It does not constitute a recommendation to buy or sell any stock, and does not take account of your objectives, or your financial situation. We aim to bring you long-term focused analysis driven by fundamental data. Note that our analysis may not factor in the latest price-sensitive company announcements or qualitative material. Simply Wall St has no position in any stocks mentioned.
*Interactive Brokers Rated Lowest Cost Broker by StockBrokers.com Annual Online Review 2020
Have feedback on this article? Concerned about the content? Get in touch with us directly. Alternatively, email editorial-team@simplywallst.com.
About SEHK:103
Shougang Century Holdings
An investment holding company, engages in the manufacture and sale of steel cords for radial tyres in the People’s Republic of China.
Excellent balance sheet with low risk.
Similar Companies
Market Insights


Advertisement
Community Narratives
The Next Phase of Defense AI: A Robotic Response to America’s Security Gaps
Fair Value US$12.00|54.3% undervalued
MA
Community Contributor
Figma (FIG): The S&P 500’s Design Standard Turning Into an All-in-One Platform
Fair Value US$65.70|7.2% overvalued
TI
Community Contributor
Sleep Cycle's Revenue Set to Rise 10% with Strong Revenue Model
Fair Value SEK 38.04|24.6% undervalued
MA
Community Contributor
Has JB Hi-Fi Lost Its Point of Difference?
Fair Value AU$76.00|51.4% overvalued
RO
Community Contributor