- Hong Kong
- /
- Household Products
- /
- SEHK:6993
Why We're Not Concerned Yet About Blue Moon Group Holdings Limited's (HKG:6993) 31% Share Price Plunge
Blue Moon Group Holdings Limited (HKG:6993) shareholders that were waiting for something to happen have been dealt a blow with a 31% share price drop in the last month. Longer-term shareholders will rue the drop in the share price, since it's now virtually flat for the year after a promising few quarters.
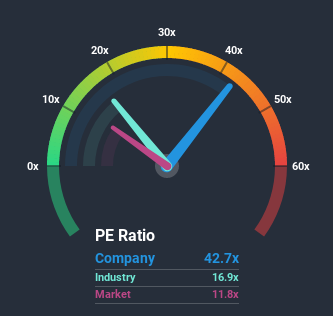
In spite of the heavy fall in price, Blue Moon Group Holdings may still be sending very bearish signals at the moment with a price-to-earnings (or "P/E") ratio of 42.7x, since almost half of all companies in Hong Kong have P/E ratios under 11x and even P/E's lower than 6x are not unusual. Although, it's not wise to just take the P/E at face value as there may be an explanation why it's so lofty.
With earnings growth that's superior to most other companies of late, Blue Moon Group Holdings has been doing relatively well. The P/E is probably high because investors think this strong earnings performance will continue. If not, then existing shareholders might be a little nervous about the viability of the share price.
Check out our latest analysis for Blue Moon Group Holdings

Does Growth Match The High P/E?
Blue Moon Group Holdings' P/E ratio would be typical for a company that's expected to deliver very strong growth, and importantly, perform much better than the market.
If we review the last year of earnings growth, the company posted a terrific increase of 20%. The latest three year period has also seen an excellent 1,411% overall rise in EPS, aided by its short-term performance. Accordingly, shareholders would have probably welcomed those medium-term rates of earnings growth.
Looking ahead now, EPS is anticipated to climb by 25% each year during the coming three years according to the seven analysts following the company. That's shaping up to be materially higher than the 21% per year growth forecast for the broader market.
In light of this, it's understandable that Blue Moon Group Holdings' P/E sits above the majority of other companies. It seems most investors are expecting this strong future growth and are willing to pay more for the stock.
What We Can Learn From Blue Moon Group Holdings' P/E?
A significant share price dive has done very little to deflate Blue Moon Group Holdings' very lofty P/E. It's argued the price-to-earnings ratio is an inferior measure of value within certain industries, but it can be a powerful business sentiment indicator.
As we suspected, our examination of Blue Moon Group Holdings' analyst forecasts revealed that its superior earnings outlook is contributing to its high P/E. At this stage investors feel the potential for a deterioration in earnings isn't great enough to justify a lower P/E ratio. It's hard to see the share price falling strongly in the near future under these circumstances.
Having said that, be aware Blue Moon Group Holdings is showing 1 warning sign in our investment analysis, you should know about.
Of course, you might also be able to find a better stock than Blue Moon Group Holdings. So you may wish to see this free collection of other companies that sit on P/E's below 20x and have grown earnings strongly.
When trading Blue Moon Group Holdings or any other investment, use the platform considered by many to be the Professional's Gateway to the Worlds Market, Interactive Brokers. You get the lowest-cost* trading on stocks, options, futures, forex, bonds and funds worldwide from a single integrated account. Promoted
Valuation is complex, but we're here to simplify it.
Discover if Blue Moon Group Holdings might be undervalued or overvalued with our detailed analysis, featuring fair value estimates, potential risks, dividends, insider trades, and its financial condition.
Access Free AnalysisThis article by Simply Wall St is general in nature. It does not constitute a recommendation to buy or sell any stock, and does not take account of your objectives, or your financial situation. We aim to bring you long-term focused analysis driven by fundamental data. Note that our analysis may not factor in the latest price-sensitive company announcements or qualitative material. Simply Wall St has no position in any stocks mentioned.
*Interactive Brokers Rated Lowest Cost Broker by StockBrokers.com Annual Online Review 2020
Have feedback on this article? Concerned about the content? Get in touch with us directly. Alternatively, email editorial-team (at) simplywallst.com.
About SEHK:6993
Blue Moon Group Holdings
Engages in the research, design, development, manufacture, and sale of personal hygiene, home care, and fabric care products in China.
Flawless balance sheet with moderate growth potential.
Market Insights
Community Narratives


