
Advertisement
- Hong Kong
- /
- Healthcare Services
- /
- SEHK:9906
Honliv Healthcare Management Group's (HKG:9906) Returns On Capital Not Reflecting Well On The Business

If you're looking for a multi-bagger, there's a few things to keep an eye out for. Firstly, we'll want to see a proven return on capital employed (ROCE) that is increasing, and secondly, an expanding base of capital employed. Ultimately, this demonstrates that it's a business that is reinvesting profits at increasing rates of return. Having said that, from a first glance at Honliv Healthcare Management Group (HKG:9906) we aren't jumping out of our chairs at how returns are trending, but let's have a deeper look.
What Is Return On Capital Employed (ROCE)?
If you haven't worked with ROCE before, it measures the 'return' (pre-tax profit) a company generates from capital employed in its business. Analysts use this formula to calculate it for Honliv Healthcare Management Group:
Return on Capital Employed = Earnings Before Interest and Tax (EBIT) ÷ (Total Assets - Current Liabilities)
0.095 = CN¥56m ÷ (CN¥993m - CN¥408m) (Based on the trailing twelve months to June 2024).
Thus, Honliv Healthcare Management Group has an ROCE of 9.5%. On its own, that's a low figure but it's around the 8.2% average generated by the Healthcare industry.
See our latest analysis for Honliv Healthcare Management Group
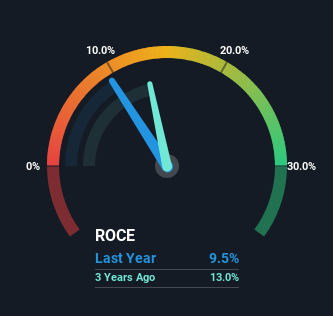
While the past is not representative of the future, it can be helpful to know how a company has performed historically, which is why we have this chart above. If you're interested in investigating Honliv Healthcare Management Group's past further, check out this free graph covering Honliv Healthcare Management Group's past earnings, revenue and cash flow.
What Can We Tell From Honliv Healthcare Management Group's ROCE Trend?
On the surface, the trend of ROCE at Honliv Healthcare Management Group doesn't inspire confidence. Around five years ago the returns on capital were 54%, but since then they've fallen to 9.5%. However, given capital employed and revenue have both increased it appears that the business is currently pursuing growth, at the consequence of short term returns. If these investments prove successful, this can bode very well for long term stock performance.
On a related note, Honliv Healthcare Management Group has decreased its current liabilities to 41% of total assets. So we could link some of this to the decrease in ROCE. Effectively this means their suppliers or short-term creditors are funding less of the business, which reduces some elements of risk. Some would claim this reduces the business' efficiency at generating ROCE since it is now funding more of the operations with its own money. Keep in mind 41% is still pretty high, so those risks are still somewhat prevalent.
The Bottom Line
While returns have fallen for Honliv Healthcare Management Group in recent times, we're encouraged to see that sales are growing and that the business is reinvesting in its operations. These trends are starting to be recognized by investors since the stock has delivered a 5.5% gain to shareholders who've held over the last three years. Therefore we'd recommend looking further into this stock to confirm if it has the makings of a good investment.
If you're still interested in Honliv Healthcare Management Group it's worth checking out our FREE intrinsic value approximation for 9906 to see if it's trading at an attractive price in other respects.
While Honliv Healthcare Management Group isn't earning the highest return, check out this free list of companies that are earning high returns on equity with solid balance sheets.
Valuation is complex, but we're here to simplify it.
Discover if Honliv Healthcare Management Group might be undervalued or overvalued with our detailed analysis, featuring fair value estimates, potential risks, dividends, insider trades, and its financial condition.
Access Free AnalysisHave feedback on this article? Concerned about the content? Get in touch with us directly. Alternatively, email editorial-team (at) simplywallst.com.
This article by Simply Wall St is general in nature. We provide commentary based on historical data and analyst forecasts only using an unbiased methodology and our articles are not intended to be financial advice. It does not constitute a recommendation to buy or sell any stock, and does not take account of your objectives, or your financial situation. We aim to bring you long-term focused analysis driven by fundamental data. Note that our analysis may not factor in the latest price-sensitive company announcements or qualitative material. Simply Wall St has no position in any stocks mentioned.
About SEHK:9906
Honliv Healthcare Management Group
Engages in the ownership, operation, and management of hospitals in the People’s Republic of China.
Flawless balance sheet with questionable track record.
Market Insights

Advertisement
Community Narratives
WhiteCap Is Positioned To Profit Regardless Of Trump's Policy 
Fair Value CA$22.60|61.6% undervalued
ST
Equity Analyst and Writer
Microsoft's Evolution Will Drive Revenue to New Heights Fueled by AI
Fair Value US$360.00|29.9% overvalued
BR
Community Contributor
A CASE FOR USD$2.50 (CAD$3.44) BY 2028 (A 5-10 BAGGER)
Fair Value CA$3.44|87.8% undervalued
AG
Community Contributor