- Hong Kong
- /
- Healthcare Services
- /
- SEHK:6639
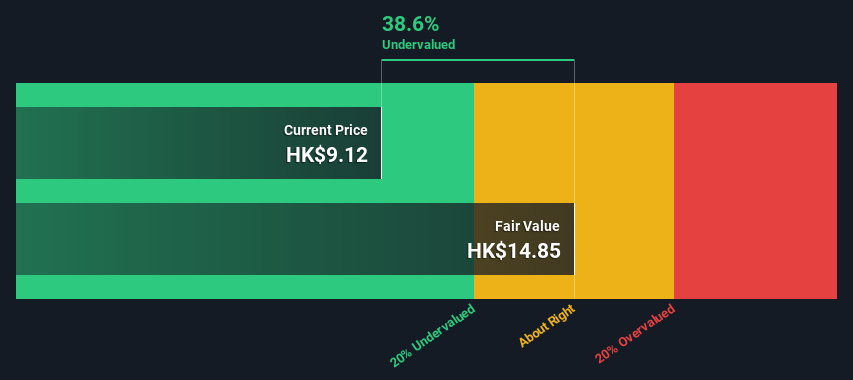
Are Investors Undervaluing Arrail Group Limited (HKG:6639) By 39%?


Key Insights
- Using the 2 Stage Free Cash Flow to Equity, Arrail Group fair value estimate is HK$14.85
- Arrail Group is estimated to be 39% undervalued based on current share price of HK$9.12
- Analyst price target for 6639 is CN¥13.25 which is 11% below our fair value estimate
Today we will run through one way of estimating the intrinsic value of Arrail Group Limited (HKG:6639) by taking the expected future cash flows and discounting them to their present value. The Discounted Cash Flow (DCF) model is the tool we will apply to do this. There's really not all that much to it, even though it might appear quite complex.
Companies can be valued in a lot of ways, so we would point out that a DCF is not perfect for every situation. Anyone interested in learning a bit more about intrinsic value should have a read of the Simply Wall St analysis model.
View our latest analysis for Arrail Group
The Model
We are going to use a two-stage DCF model, which, as the name states, takes into account two stages of growth. The first stage is generally a higher growth period which levels off heading towards the terminal value, captured in the second 'steady growth' period. In the first stage we need to estimate the cash flows to the business over the next ten years. Where possible we use analyst estimates, but when these aren't available we extrapolate the previous free cash flow (FCF) from the last estimate or reported value. We assume companies with shrinking free cash flow will slow their rate of shrinkage, and that companies with growing free cash flow will see their growth rate slow, over this period. We do this to reflect that growth tends to slow more in the early years than it does in later years.
Generally we assume that a dollar today is more valuable than a dollar in the future, and so the sum of these future cash flows is then discounted to today's value:
10-year free cash flow (FCF) estimate
| 2023 | 2024 | 2025 | 2026 | 2027 | 2028 | 2029 | 2030 | 2031 | 2032 | |
| Levered FCF (CN¥, Millions) | -CN¥71.0m | CN¥212.0m | CN¥266.0m | CN¥325.0m | CN¥391.0m | CN¥463.0m | CN¥515.7m | CN¥559.5m | CN¥595.8m | CN¥626.1m |
| Growth Rate Estimate Source | Analyst x1 | Analyst x1 | Analyst x1 | Analyst x1 | Analyst x1 | Analyst x1 | Est @ 11.38% | Est @ 8.50% | Est @ 6.49% | Est @ 5.08% |
| Present Value (CN¥, Millions) Discounted @ 7.5% | -CN¥66.0 | CN¥183 | CN¥214 | CN¥243 | CN¥272 | CN¥299 | CN¥310 | CN¥313 | CN¥310 | CN¥303 |
("Est" = FCF growth rate estimated by Simply Wall St)
Present Value of 10-year Cash Flow (PVCF) = CN¥2.4b
We now need to calculate the Terminal Value, which accounts for all the future cash flows after this ten year period. The Gordon Growth formula is used to calculate Terminal Value at a future annual growth rate equal to the 5-year average of the 10-year government bond yield of 1.8%. We discount the terminal cash flows to today's value at a cost of equity of 7.5%.
Terminal Value (TV)= FCF2032 × (1 + g) ÷ (r – g) = CN¥626m× (1 + 1.8%) ÷ (7.5%– 1.8%) = CN¥11b
Present Value of Terminal Value (PVTV)= TV / (1 + r)10= CN¥11b÷ ( 1 + 7.5%)10= CN¥5.4b
The total value, or equity value, is then the sum of the present value of the future cash flows, which in this case is CN¥7.8b. In the final step we divide the equity value by the number of shares outstanding. Compared to the current share price of HK$9.1, the company appears quite undervalued at a 39% discount to where the stock price trades currently. Valuations are imprecise instruments though, rather like a telescope - move a few degrees and end up in a different galaxy. Do keep this in mind.
The Assumptions
We would point out that the most important inputs to a discounted cash flow are the discount rate and of course the actual cash flows. Part of investing is coming up with your own evaluation of a company's future performance, so try the calculation yourself and check your own assumptions. The DCF also does not consider the possible cyclicality of an industry, or a company's future capital requirements, so it does not give a full picture of a company's potential performance. Given that we are looking at Arrail Group as potential shareholders, the cost of equity is used as the discount rate, rather than the cost of capital (or weighted average cost of capital, WACC) which accounts for debt. In this calculation we've used 7.5%, which is based on a levered beta of 0.801. Beta is a measure of a stock's volatility, compared to the market as a whole. We get our beta from the industry average beta of globally comparable companies, with an imposed limit between 0.8 and 2.0, which is a reasonable range for a stable business.
Moving On:
Although the valuation of a company is important, it is only one of many factors that you need to assess for a company. The DCF model is not a perfect stock valuation tool. Instead the best use for a DCF model is to test certain assumptions and theories to see if they would lead to the company being undervalued or overvalued. For example, changes in the company's cost of equity or the risk free rate can significantly impact the valuation. Why is the intrinsic value higher than the current share price? For Arrail Group, there are three essential elements you should assess:
- Risks: Every company has them, and we've spotted 2 warning signs for Arrail Group you should know about.
- Management:Have insiders been ramping up their shares to take advantage of the market's sentiment for 6639's future outlook? Check out our management and board analysis with insights on CEO compensation and governance factors.
- Other High Quality Alternatives: Do you like a good all-rounder? Explore our interactive list of high quality stocks to get an idea of what else is out there you may be missing!
PS. Simply Wall St updates its DCF calculation for every Hong Kong stock every day, so if you want to find the intrinsic value of any other stock just search here.
New: Manage All Your Stock Portfolios in One Place
We've created the ultimate portfolio companion for stock investors, and it's free.
• Connect an unlimited number of Portfolios and see your total in one currency
• Be alerted to new Warning Signs or Risks via email or mobile
• Track the Fair Value of your stocks
Have feedback on this article? Concerned about the content? Get in touch with us directly. Alternatively, email editorial-team (at) simplywallst.com.
This article by Simply Wall St is general in nature. We provide commentary based on historical data and analyst forecasts only using an unbiased methodology and our articles are not intended to be financial advice. It does not constitute a recommendation to buy or sell any stock, and does not take account of your objectives, or your financial situation. We aim to bring you long-term focused analysis driven by fundamental data. Note that our analysis may not factor in the latest price-sensitive company announcements or qualitative material. Simply Wall St has no position in any stocks mentioned.
About SEHK:6639
Excellent balance sheet and slightly overvalued.
Similar Companies
Market Insights

Community Narratives


