- Hong Kong
- /
- Healthcare Services
- /
- SEHK:574
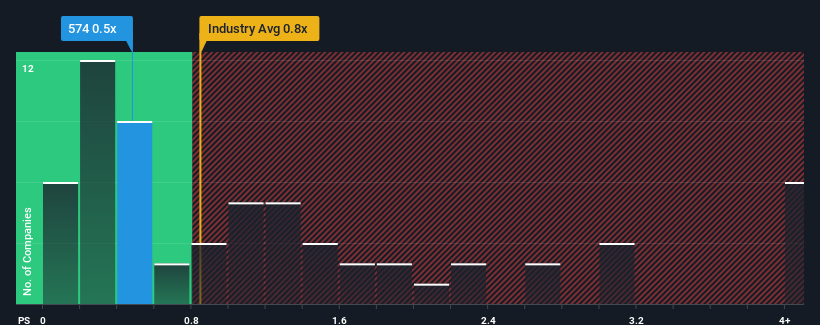
Risks To Shareholder Returns Are Elevated At These Prices For Pa Shun International Holdings Limited (HKG:574)


With a median price-to-sales (or "P/S") ratio of close to 0.8x in the Healthcare industry in Hong Kong, you could be forgiven for feeling indifferent about Pa Shun International Holdings Limited's (HKG:574) P/S ratio of 0.5x. Although, it's not wise to simply ignore the P/S without explanation as investors may be disregarding a distinct opportunity or a costly mistake.
Our free stock report includes 2 warning signs investors should be aware of before investing in Pa Shun International Holdings. Read for free now.View our latest analysis for Pa Shun International Holdings
What Does Pa Shun International Holdings' P/S Mean For Shareholders?
For instance, Pa Shun International Holdings' receding revenue in recent times would have to be some food for thought. One possibility is that the P/S is moderate because investors think the company might still do enough to be in line with the broader industry in the near future. If not, then existing shareholders may be a little nervous about the viability of the share price.
Although there are no analyst estimates available for Pa Shun International Holdings, take a look at this free data-rich visualisation to see how the company stacks up on earnings, revenue and cash flow.Is There Some Revenue Growth Forecasted For Pa Shun International Holdings?
There's an inherent assumption that a company should be matching the industry for P/S ratios like Pa Shun International Holdings' to be considered reasonable.
In reviewing the last year of financials, we were disheartened to see the company's revenues fell to the tune of 33%. This has erased any of its gains during the last three years, with practically no change in revenue being achieved in total. So it appears to us that the company has had a mixed result in terms of growing revenue over that time.
Comparing the recent medium-term revenue trends against the industry's one-year growth forecast of 8.9% shows it's noticeably less attractive.
With this in mind, we find it intriguing that Pa Shun International Holdings' P/S is comparable to that of its industry peers. It seems most investors are ignoring the fairly limited recent growth rates and are willing to pay up for exposure to the stock. Maintaining these prices will be difficult to achieve as a continuation of recent revenue trends is likely to weigh down the shares eventually.
The Final Word
We'd say the price-to-sales ratio's power isn't primarily as a valuation instrument but rather to gauge current investor sentiment and future expectations.
We've established that Pa Shun International Holdings' average P/S is a bit surprising since its recent three-year growth is lower than the wider industry forecast. When we see weak revenue with slower than industry growth, we suspect the share price is at risk of declining, bringing the P/S back in line with expectations. If recent medium-term revenue trends continue, the probability of a share price decline will become quite substantial, placing shareholders at risk.
You should always think about risks. Case in point, we've spotted 2 warning signs for Pa Shun International Holdings you should be aware of.
If you're unsure about the strength of Pa Shun International Holdings' business, why not explore our interactive list of stocks with solid business fundamentals for some other companies you may have missed.
If you're looking to trade Pa Shun International Holdings, open an account with the lowest-cost platform trusted by professionals, Interactive Brokers.
With clients in over 200 countries and territories, and access to 160 markets, IBKR lets you trade stocks, options, futures, forex, bonds and funds from a single integrated account.
Enjoy no hidden fees, no account minimums, and FX conversion rates as low as 0.03%, far better than what most brokers offer.
Sponsored ContentNew: Manage All Your Stock Portfolios in One Place
We've created the ultimate portfolio companion for stock investors, and it's free.
• Connect an unlimited number of Portfolios and see your total in one currency
• Be alerted to new Warning Signs or Risks via email or mobile
• Track the Fair Value of your stocks
Have feedback on this article? Concerned about the content? Get in touch with us directly. Alternatively, email editorial-team (at) simplywallst.com.
This article by Simply Wall St is general in nature. We provide commentary based on historical data and analyst forecasts only using an unbiased methodology and our articles are not intended to be financial advice. It does not constitute a recommendation to buy or sell any stock, and does not take account of your objectives, or your financial situation. We aim to bring you long-term focused analysis driven by fundamental data. Note that our analysis may not factor in the latest price-sensitive company announcements or qualitative material. Simply Wall St has no position in any stocks mentioned.
About SEHK:574
Pa Shun International Holdings
An investment holding company, engages in the pharmaceutical distribution and manufacturing business in the People’s Republic of China.
Low and slightly overvalued.
Market Insights

Community Narratives

