- Hong Kong
- /
- Healthcare Services
- /
- SEHK:574
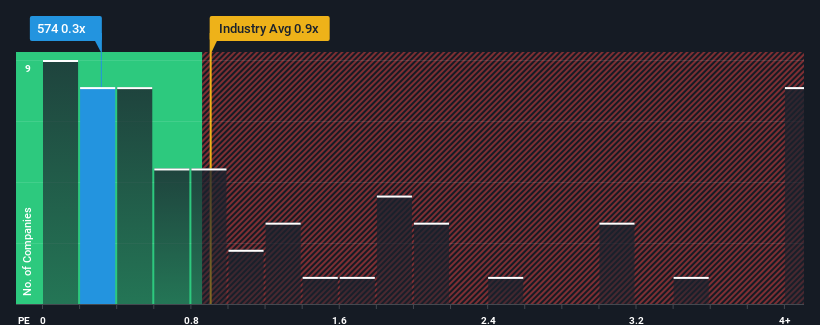
Revenues Working Against Pa Shun International Holdings Limited's (HKG:574) Share Price Following 30% Dive


To the annoyance of some shareholders, Pa Shun International Holdings Limited (HKG:574) shares are down a considerable 30% in the last month, which continues a horrid run for the company. Longer-term shareholders will rue the drop in the share price, since it's now virtually flat for the year after a promising few quarters.
Even after such a large drop in price, Pa Shun International Holdings may still be sending buy signals at present with its price-to-sales (or "P/S") ratio of 0.3x, considering almost half of all companies in the Healthcare industry in Hong Kong have P/S ratios greater than 0.9x and even P/S higher than 3x aren't out of the ordinary. Nonetheless, we'd need to dig a little deeper to determine if there is a rational basis for the reduced P/S.
Check out our latest analysis for Pa Shun International Holdings
What Does Pa Shun International Holdings' P/S Mean For Shareholders?
With revenue growth that's exceedingly strong of late, Pa Shun International Holdings has been doing very well. One possibility is that the P/S ratio is low because investors think this strong revenue growth might actually underperform the broader industry in the near future. If that doesn't eventuate, then existing shareholders have reason to be quite optimistic about the future direction of the share price.
Want the full picture on earnings, revenue and cash flow for the company? Then our free report on Pa Shun International Holdings will help you shine a light on its historical performance.How Is Pa Shun International Holdings' Revenue Growth Trending?
There's an inherent assumption that a company should underperform the industry for P/S ratios like Pa Shun International Holdings' to be considered reasonable.
If we review the last year of revenue growth, the company posted a terrific increase of 80%. However, this wasn't enough as the latest three year period has seen the company endure a nasty 73% drop in revenue in aggregate. Accordingly, shareholders would have felt downbeat about the medium-term rates of revenue growth.
Comparing that to the industry, which is predicted to deliver 15% growth in the next 12 months, the company's downward momentum based on recent medium-term revenue results is a sobering picture.
With this in mind, we understand why Pa Shun International Holdings' P/S is lower than most of its industry peers. However, we think shrinking revenues are unlikely to lead to a stable P/S over the longer term, which could set up shareholders for future disappointment. Even just maintaining these prices could be difficult to achieve as recent revenue trends are already weighing down the shares.
What Does Pa Shun International Holdings' P/S Mean For Investors?
Pa Shun International Holdings' recently weak share price has pulled its P/S back below other Healthcare companies. Using the price-to-sales ratio alone to determine if you should sell your stock isn't sensible, however it can be a practical guide to the company's future prospects.
As we suspected, our examination of Pa Shun International Holdings revealed its shrinking revenue over the medium-term is contributing to its low P/S, given the industry is set to grow. Right now shareholders are accepting the low P/S as they concede future revenue probably won't provide any pleasant surprises either. Given the current circumstances, it seems unlikely that the share price will experience any significant movement in either direction in the near future if recent medium-term revenue trends persist.
We don't want to rain on the parade too much, but we did also find 5 warning signs for Pa Shun International Holdings (4 are concerning!) that you need to be mindful of.
If you're unsure about the strength of Pa Shun International Holdings' business, why not explore our interactive list of stocks with solid business fundamentals for some other companies you may have missed.
New: Manage All Your Stock Portfolios in One Place
We've created the ultimate portfolio companion for stock investors, and it's free.
• Connect an unlimited number of Portfolios and see your total in one currency
• Be alerted to new Warning Signs or Risks via email or mobile
• Track the Fair Value of your stocks
Have feedback on this article? Concerned about the content? Get in touch with us directly. Alternatively, email editorial-team (at) simplywallst.com.
This article by Simply Wall St is general in nature. We provide commentary based on historical data and analyst forecasts only using an unbiased methodology and our articles are not intended to be financial advice. It does not constitute a recommendation to buy or sell any stock, and does not take account of your objectives, or your financial situation. We aim to bring you long-term focused analysis driven by fundamental data. Note that our analysis may not factor in the latest price-sensitive company announcements or qualitative material. Simply Wall St has no position in any stocks mentioned.
About SEHK:574
Pa Shun International Holdings
An investment holding company, engages in the pharmaceutical distribution and manufacturing business in the People’s Republic of China.
Low and slightly overvalued.
Market Insights

Community Narratives

