- Hong Kong
- /
- Healthcare Services
- /
- SEHK:574
Pa Shun International Holdings Limited (HKG:574) Shares May Have Slumped 33% But Getting In Cheap Is Still Unlikely


Pa Shun International Holdings Limited (HKG:574) shareholders won't be pleased to see that the share price has had a very rough month, dropping 33% and undoing the prior period's positive performance. Longer-term shareholders will rue the drop in the share price, since it's now virtually flat for the year after a promising few quarters.
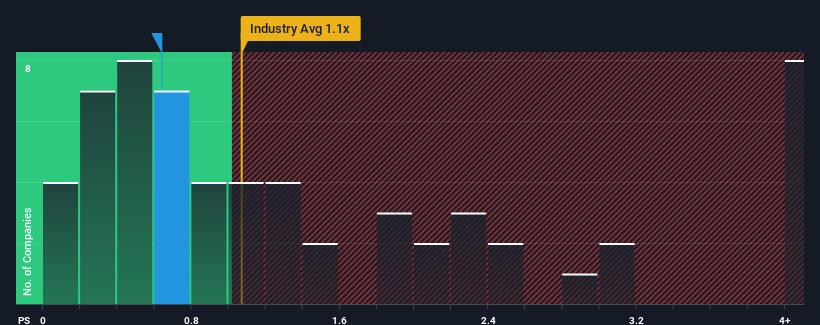
In spite of the heavy fall in price, there still wouldn't be many who think Pa Shun International Holdings' price-to-sales (or "P/S") ratio of 0.6x is worth a mention when the median P/S in Hong Kong's Healthcare industry is similar at about 1.1x. While this might not raise any eyebrows, if the P/S ratio is not justified investors could be missing out on a potential opportunity or ignoring looming disappointment.
View our latest analysis for Pa Shun International Holdings
What Does Pa Shun International Holdings' P/S Mean For Shareholders?
With revenue growth that's exceedingly strong of late, Pa Shun International Holdings has been doing very well. Perhaps the market is expecting future revenue performance to taper off, which has kept the P/S from rising. Those who are bullish on Pa Shun International Holdings will be hoping that this isn't the case, so that they can pick up the stock at a lower valuation.
We don't have analyst forecasts, but you can see how recent trends are setting up the company for the future by checking out our free report on Pa Shun International Holdings' earnings, revenue and cash flow.How Is Pa Shun International Holdings' Revenue Growth Trending?
In order to justify its P/S ratio, Pa Shun International Holdings would need to produce growth that's similar to the industry.
If we review the last year of revenue growth, the company posted a terrific increase of 71%. Still, revenue has fallen 81% in total from three years ago, which is quite disappointing. Therefore, it's fair to say the revenue growth recently has been undesirable for the company.
Weighing that medium-term revenue trajectory against the broader industry's one-year forecast for expansion of 16% shows it's an unpleasant look.
In light of this, it's somewhat alarming that Pa Shun International Holdings' P/S sits in line with the majority of other companies. Apparently many investors in the company are way less bearish than recent times would indicate and aren't willing to let go of their stock right now. Only the boldest would assume these prices are sustainable as a continuation of recent revenue trends is likely to weigh on the share price eventually.
What Does Pa Shun International Holdings' P/S Mean For Investors?
Following Pa Shun International Holdings' share price tumble, its P/S is just clinging on to the industry median P/S. Using the price-to-sales ratio alone to determine if you should sell your stock isn't sensible, however it can be a practical guide to the company's future prospects.
Our look at Pa Shun International Holdings revealed its shrinking revenues over the medium-term haven't impacted the P/S as much as we anticipated, given the industry is set to grow. Even though it matches the industry, we're uncomfortable with the current P/S ratio, as this dismal revenue performance is unlikely to support a more positive sentiment for long. Unless the the circumstances surrounding the recent medium-term improve, it wouldn't be wrong to expect a a difficult period ahead for the company's shareholders.
It's always necessary to consider the ever-present spectre of investment risk. We've identified 4 warning signs with Pa Shun International Holdings (at least 3 which can't be ignored), and understanding these should be part of your investment process.
It's important to make sure you look for a great company, not just the first idea you come across. So if growing profitability aligns with your idea of a great company, take a peek at this free list of interesting companies with strong recent earnings growth (and a low P/E).
If you're looking to trade Pa Shun International Holdings, open an account with the lowest-cost platform trusted by professionals, Interactive Brokers.
With clients in over 200 countries and territories, and access to 160 markets, IBKR lets you trade stocks, options, futures, forex, bonds and funds from a single integrated account.
Enjoy no hidden fees, no account minimums, and FX conversion rates as low as 0.03%, far better than what most brokers offer.
Sponsored ContentNew: Manage All Your Stock Portfolios in One Place
We've created the ultimate portfolio companion for stock investors, and it's free.
• Connect an unlimited number of Portfolios and see your total in one currency
• Be alerted to new Warning Signs or Risks via email or mobile
• Track the Fair Value of your stocks
Have feedback on this article? Concerned about the content? Get in touch with us directly. Alternatively, email editorial-team (at) simplywallst.com.
This article by Simply Wall St is general in nature. We provide commentary based on historical data and analyst forecasts only using an unbiased methodology and our articles are not intended to be financial advice. It does not constitute a recommendation to buy or sell any stock, and does not take account of your objectives, or your financial situation. We aim to bring you long-term focused analysis driven by fundamental data. Note that our analysis may not factor in the latest price-sensitive company announcements or qualitative material. Simply Wall St has no position in any stocks mentioned.
About SEHK:574
Pa Shun International Holdings
An investment holding company, engages in the pharmaceutical distribution and manufacturing business in the People’s Republic of China.
Low and slightly overvalued.
Market Insights

Community Narratives

