
Advertisement
- Hong Kong
- /
- Medical Equipment
- /
- SEHK:1858
Market Participants Recognise Beijing Chunlizhengda Medical Instruments Co., Ltd.'s (HKG:1858) Earnings Pushing Shares 30% Higher
The Beijing Chunlizhengda Medical Instruments Co., Ltd. (HKG:1858) share price has done very well over the last month, posting an excellent gain of 30%. Looking back a bit further, it's encouraging to see the stock is up 30% in the last year.
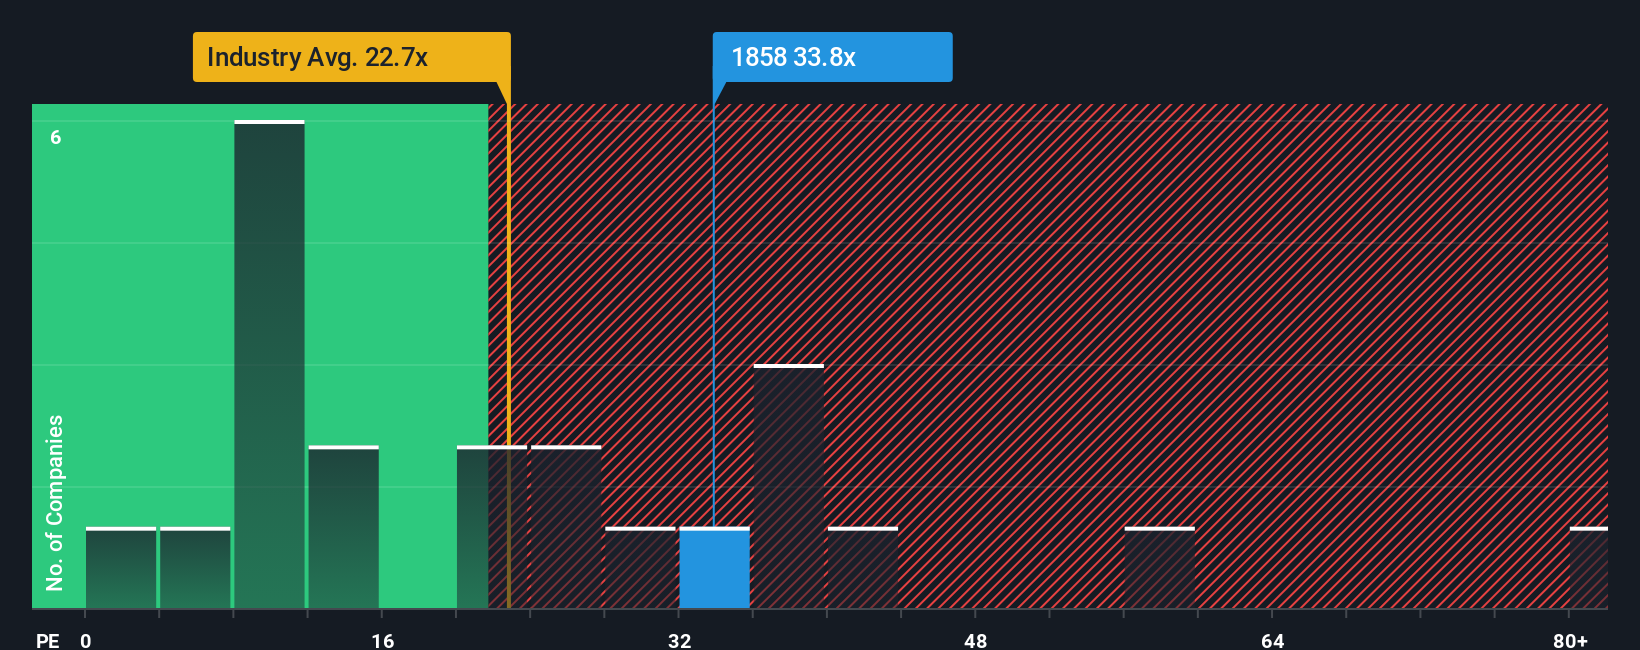
After such a large jump in price, Beijing Chunlizhengda Medical Instruments' price-to-earnings (or "P/E") ratio of 33.8x might make it look like a strong sell right now compared to the market in Hong Kong, where around half of the companies have P/E ratios below 11x and even P/E's below 6x are quite common. Although, it's not wise to just take the P/E at face value as there may be an explanation why it's so lofty.
While the market has experienced earnings growth lately, Beijing Chunlizhengda Medical Instruments' earnings have gone into reverse gear, which is not great. One possibility is that the P/E is high because investors think this poor earnings performance will turn the corner. You'd really hope so, otherwise you're paying a pretty hefty price for no particular reason.
View our latest analysis for Beijing Chunlizhengda Medical Instruments
Does Growth Match The High P/E?
Beijing Chunlizhengda Medical Instruments' P/E ratio would be typical for a company that's expected to deliver very strong growth, and importantly, perform much better than the market.
Taking a look back first, the company's earnings per share growth last year wasn't something to get excited about as it posted a disappointing decline of 52%. The last three years don't look nice either as the company has shrunk EPS by 63% in aggregate. Accordingly, shareholders would have felt downbeat about the medium-term rates of earnings growth.
Shifting to the future, estimates from the three analysts covering the company suggest earnings should grow by 28% per year over the next three years. That's shaping up to be materially higher than the 14% per annum growth forecast for the broader market.
In light of this, it's understandable that Beijing Chunlizhengda Medical Instruments' P/E sits above the majority of other companies. Apparently shareholders aren't keen to offload something that is potentially eyeing a more prosperous future.

The Key Takeaway
Shares in Beijing Chunlizhengda Medical Instruments have built up some good momentum lately, which has really inflated its P/E. Using the price-to-earnings ratio alone to determine if you should sell your stock isn't sensible, however it can be a practical guide to the company's future prospects.
As we suspected, our examination of Beijing Chunlizhengda Medical Instruments' analyst forecasts revealed that its superior earnings outlook is contributing to its high P/E. At this stage investors feel the potential for a deterioration in earnings isn't great enough to justify a lower P/E ratio. It's hard to see the share price falling strongly in the near future under these circumstances.
Plus, you should also learn about this 1 warning sign we've spotted with Beijing Chunlizhengda Medical Instruments.
Of course, you might also be able to find a better stock than Beijing Chunlizhengda Medical Instruments. So you may wish to see this free collection of other companies that have reasonable P/E ratios and have grown earnings strongly.
Valuation is complex, but we're here to simplify it.
Discover if Beijing Chunlizhengda Medical Instruments might be undervalued or overvalued with our detailed analysis, featuring fair value estimates, potential risks, dividends, insider trades, and its financial condition.
Access Free AnalysisHave feedback on this article? Concerned about the content? Get in touch with us directly. Alternatively, email editorial-team (at) simplywallst.com.
This article by Simply Wall St is general in nature. We provide commentary based on historical data and analyst forecasts only using an unbiased methodology and our articles are not intended to be financial advice. It does not constitute a recommendation to buy or sell any stock, and does not take account of your objectives, or your financial situation. We aim to bring you long-term focused analysis driven by fundamental data. Note that our analysis may not factor in the latest price-sensitive company announcements or qualitative material. Simply Wall St has no position in any stocks mentioned.
About SEHK:1858
Beijing Chunlizhengda Medical Instruments
Beijing Chunlizhengda Medical Instruments Co., Ltd.
Flawless balance sheet with reasonable growth potential.
Similar Companies
Market Insights

Advertisement
Community Narratives
The Next Phase of Energy Storage: How NeoVolta Is Tackling America’s Power Crunch
Fair Value US$7.50|35.1% undervalued
MA
Community Contributor
Why EnSilica is Worth Possibly 13x its Current Price
Fair Value UK£5.00|89.8% undervalued
DO
Community Contributor
M&A Activity, Industry Diversification & A Defense Contract Monopoly Will Push BWXT For Healthy Long-Term Growth
Fair Value US$220.00|15.2% undervalued
CL
Community Contributor
A case for Cassiar Gold Corp (TSXV: GLDC) to reach CAD$8-10 before 2030 (X30-37)
Fair Value CA$10.00|96.0% undervalued
AG
Community Contributor