- Hong Kong
- /
- Healthcare Services
- /
- SEHK:1110
The Return Trends At Kingworld Medicines Group (HKG:1110) Look Promising


If you're not sure where to start when looking for the next multi-bagger, there are a few key trends you should keep an eye out for. Ideally, a business will show two trends; firstly a growing return on capital employed (ROCE) and secondly, an increasing amount of capital employed. Put simply, these types of businesses are compounding machines, meaning they are continually reinvesting their earnings at ever-higher rates of return. So when we looked at Kingworld Medicines Group (HKG:1110) and its trend of ROCE, we really liked what we saw.
What Is Return On Capital Employed (ROCE)?
Just to clarify if you're unsure, ROCE is a metric for evaluating how much pre-tax income (in percentage terms) a company earns on the capital invested in its business. To calculate this metric for Kingworld Medicines Group, this is the formula:
Return on Capital Employed = Earnings Before Interest and Tax (EBIT) ÷ (Total Assets - Current Liabilities)
0.13 = CN¥101m ÷ (CN¥1.4b - CN¥584m) (Based on the trailing twelve months to June 2023).
Thus, Kingworld Medicines Group has an ROCE of 13%. On its own, that's a standard return, however it's much better than the 11% generated by the Healthcare industry.
See our latest analysis for Kingworld Medicines Group
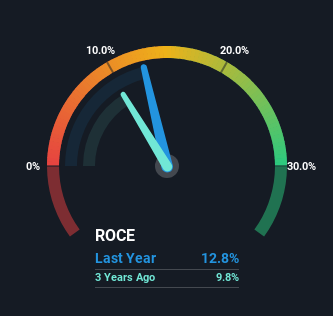
Historical performance is a great place to start when researching a stock so above you can see the gauge for Kingworld Medicines Group's ROCE against it's prior returns. If you'd like to look at how Kingworld Medicines Group has performed in the past in other metrics, you can view this free graph of past earnings, revenue and cash flow.
What Can We Tell From Kingworld Medicines Group's ROCE Trend?
Kingworld Medicines Group is showing promise given that its ROCE is trending up and to the right. Looking at the data, we can see that even though capital employed in the business has remained relatively flat, the ROCE generated has risen by 42% over the last five years. So it's likely that the business is now reaping the full benefits of its past investments, since the capital employed hasn't changed considerably. It's worth looking deeper into this though because while it's great that the business is more efficient, it might also mean that going forward the areas to invest internally for the organic growth are lacking.
On a separate but related note, it's important to know that Kingworld Medicines Group has a current liabilities to total assets ratio of 43%, which we'd consider pretty high. This effectively means that suppliers (or short-term creditors) are funding a large portion of the business, so just be aware that this can introduce some elements of risk. While it's not necessarily a bad thing, it can be beneficial if this ratio is lower.
In Conclusion...
To sum it up, Kingworld Medicines Group is collecting higher returns from the same amount of capital, and that's impressive. Given the stock has declined 14% in the last five years, this could be a good investment if the valuation and other metrics are also appealing. So researching this company further and determining whether or not these trends will continue seems justified.
One more thing: We've identified 3 warning signs with Kingworld Medicines Group (at least 1 which is concerning) , and understanding these would certainly be useful.
For those who like to invest in solid companies, check out this free list of companies with solid balance sheets and high returns on equity.
If you're looking to trade Kingworld Medicines Group, open an account with the lowest-cost platform trusted by professionals, Interactive Brokers.
With clients in over 200 countries and territories, and access to 160 markets, IBKR lets you trade stocks, options, futures, forex, bonds and funds from a single integrated account.
Enjoy no hidden fees, no account minimums, and FX conversion rates as low as 0.03%, far better than what most brokers offer.
Sponsored ContentValuation is complex, but we're here to simplify it.
Discover if Kingworld Medicines Group might be undervalued or overvalued with our detailed analysis, featuring fair value estimates, potential risks, dividends, insider trades, and its financial condition.
Access Free AnalysisHave feedback on this article? Concerned about the content? Get in touch with us directly. Alternatively, email editorial-team (at) simplywallst.com.
This article by Simply Wall St is general in nature. We provide commentary based on historical data and analyst forecasts only using an unbiased methodology and our articles are not intended to be financial advice. It does not constitute a recommendation to buy or sell any stock, and does not take account of your objectives, or your financial situation. We aim to bring you long-term focused analysis driven by fundamental data. Note that our analysis may not factor in the latest price-sensitive company announcements or qualitative material. Simply Wall St has no position in any stocks mentioned.
About SEHK:1110
Kingworld Medicines Group
An investment holding company, primarily engages in the distribution and sale of branded imported pharmaceutical and healthcare products.
Excellent balance sheet, good value and pays a dividend.
Market Insights

Community Narratives

