Is Vedan International (Holdings) (HKG:2317) Using Too Much Debt?


Some say volatility, rather than debt, is the best way to think about risk as an investor, but Warren Buffett famously said that 'Volatility is far from synonymous with risk.' So it seems the smart money knows that debt - which is usually involved in bankruptcies - is a very important factor, when you assess how risky a company is. We can see that Vedan International (Holdings) Limited (HKG:2317) does use debt in its business. But should shareholders be worried about its use of debt?
Why Does Debt Bring Risk?
Debt and other liabilities become risky for a business when it cannot easily fulfill those obligations, either with free cash flow or by raising capital at an attractive price. Ultimately, if the company can't fulfill its legal obligations to repay debt, shareholders could walk away with nothing. However, a more usual (but still expensive) situation is where a company must dilute shareholders at a cheap share price simply to get debt under control. Of course, plenty of companies use debt to fund growth, without any negative consequences. When we examine debt levels, we first consider both cash and debt levels, together.
Check out our latest analysis for Vedan International (Holdings)
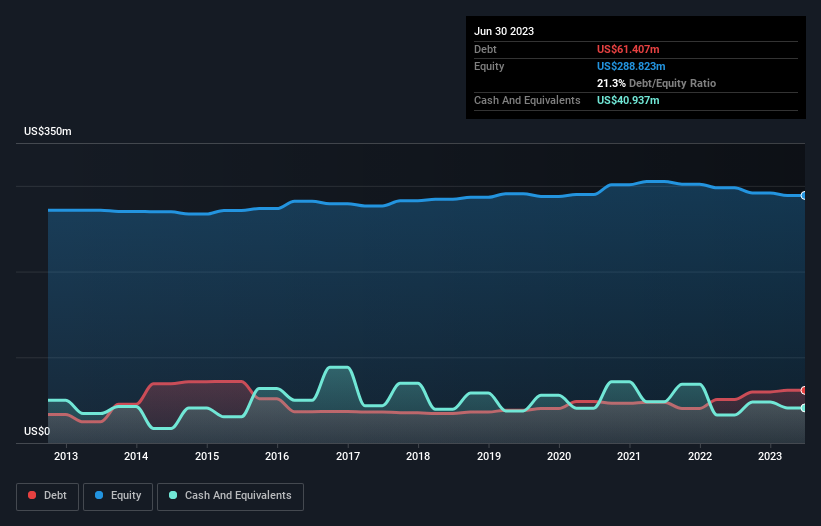
What Is Vedan International (Holdings)'s Debt?
The image below, which you can click on for greater detail, shows that at June 2023 Vedan International (Holdings) had debt of US$61.4m, up from US$50.8m in one year. However, it also had US$40.9m in cash, and so its net debt is US$20.5m.
A Look At Vedan International (Holdings)'s Liabilities
Zooming in on the latest balance sheet data, we can see that Vedan International (Holdings) had liabilities of US$95.9m due within 12 months and liabilities of US$7.66m due beyond that. Offsetting this, it had US$40.9m in cash and US$30.4m in receivables that were due within 12 months. So its liabilities total US$32.2m more than the combination of its cash and short-term receivables.
This deficit isn't so bad because Vedan International (Holdings) is worth US$77.7m, and thus could probably raise enough capital to shore up its balance sheet, if the need arose. However, it is still worthwhile taking a close look at its ability to pay off debt. When analysing debt levels, the balance sheet is the obvious place to start. But you can't view debt in total isolation; since Vedan International (Holdings) will need earnings to service that debt. So when considering debt, it's definitely worth looking at the earnings trend. Click here for an interactive snapshot.
In the last year Vedan International (Holdings)'s revenue was pretty flat, and it made a negative EBIT. While that hardly impresses, its not too bad either.
Caveat Emptor
Over the last twelve months Vedan International (Holdings) produced an earnings before interest and tax (EBIT) loss. Indeed, it lost US$2.5m at the EBIT level. Considering that alongside the liabilities mentioned above does not give us much confidence that company should be using so much debt. Quite frankly we think the balance sheet is far from match-fit, although it could be improved with time. However, it doesn't help that it burned through US$36m of cash over the last year. So suffice it to say we consider the stock very risky. The balance sheet is clearly the area to focus on when you are analysing debt. But ultimately, every company can contain risks that exist outside of the balance sheet. These risks can be hard to spot. Every company has them, and we've spotted 4 warning signs for Vedan International (Holdings) (of which 2 shouldn't be ignored!) you should know about.
If, after all that, you're more interested in a fast growing company with a rock-solid balance sheet, then check out our list of net cash growth stocks without delay.
If you're looking to trade Vedan International (Holdings), open an account with the lowest-cost platform trusted by professionals, Interactive Brokers.
With clients in over 200 countries and territories, and access to 160 markets, IBKR lets you trade stocks, options, futures, forex, bonds and funds from a single integrated account.
Enjoy no hidden fees, no account minimums, and FX conversion rates as low as 0.03%, far better than what most brokers offer.
Sponsored ContentNew: Manage All Your Stock Portfolios in One Place
We've created the ultimate portfolio companion for stock investors, and it's free.
• Connect an unlimited number of Portfolios and see your total in one currency
• Be alerted to new Warning Signs or Risks via email or mobile
• Track the Fair Value of your stocks
Have feedback on this article? Concerned about the content? Get in touch with us directly. Alternatively, email editorial-team (at) simplywallst.com.
This article by Simply Wall St is general in nature. We provide commentary based on historical data and analyst forecasts only using an unbiased methodology and our articles are not intended to be financial advice. It does not constitute a recommendation to buy or sell any stock, and does not take account of your objectives, or your financial situation. We aim to bring you long-term focused analysis driven by fundamental data. Note that our analysis may not factor in the latest price-sensitive company announcements or qualitative material. Simply Wall St has no position in any stocks mentioned.
About SEHK:2317
Vedan International (Holdings)
An investment holding company, manufactures and sells fermentation-based amino acids, food additive, biochemical, and cassava starch based industrial products.
Flawless balance sheet established dividend payer.
Market Insights

Community Narratives

