- Hong Kong
- /
- Oil and Gas
- /
- SEHK:65
Grand Ocean Advanced Resources Company Limited's (HKG:65) Stock Retreats 31% But Revenues Haven't Escaped The Attention Of Investors
To the annoyance of some shareholders, Grand Ocean Advanced Resources Company Limited (HKG:65) shares are down a considerable 31% in the last month, which continues a horrid run for the company. For any long-term shareholders, the last month ends a year to forget by locking in a 70% share price decline.
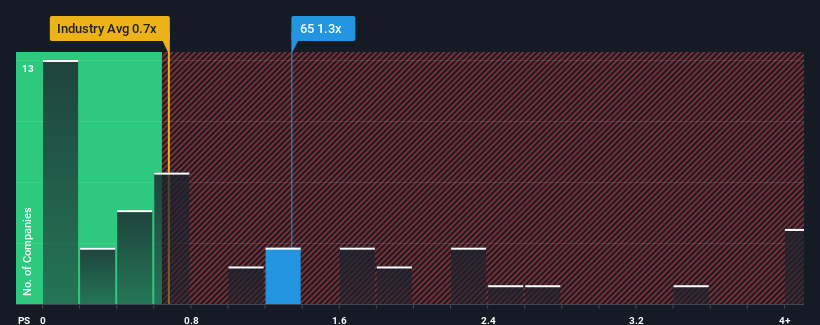
Even after such a large drop in price, given close to half the companies operating in Hong Kong's Oil and Gas industry have price-to-sales ratios (or "P/S") below 0.7x, you may still consider Grand Ocean Advanced Resources as a stock to potentially avoid with its 1.3x P/S ratio. Although, it's not wise to just take the P/S at face value as there may be an explanation why it's as high as it is.
Check out our latest analysis for Grand Ocean Advanced Resources

How Grand Ocean Advanced Resources Has Been Performing
For example, consider that Grand Ocean Advanced Resources' financial performance has been poor lately as its revenue has been in decline. Perhaps the market believes the company can do enough to outperform the rest of the industry in the near future, which is keeping the P/S ratio high. You'd really hope so, otherwise you're paying a pretty hefty price for no particular reason.
Although there are no analyst estimates available for Grand Ocean Advanced Resources, take a look at this free data-rich visualisation to see how the company stacks up on earnings, revenue and cash flow.Is There Enough Revenue Growth Forecasted For Grand Ocean Advanced Resources?
Grand Ocean Advanced Resources' P/S ratio would be typical for a company that's expected to deliver solid growth, and importantly, perform better than the industry.
Retrospectively, the last year delivered a frustrating 1.7% decrease to the company's top line. Still, the latest three year period has seen an excellent 41% overall rise in revenue, in spite of its unsatisfying short-term performance. Although it's been a bumpy ride, it's still fair to say the revenue growth recently has been more than adequate for the company.
This is in contrast to the rest of the industry, which is expected to grow by 1.8% over the next year, materially lower than the company's recent medium-term annualised growth rates.
With this information, we can see why Grand Ocean Advanced Resources is trading at such a high P/S compared to the industry. Presumably shareholders aren't keen to offload something they believe will continue to outmanoeuvre the wider industry.
What Does Grand Ocean Advanced Resources' P/S Mean For Investors?
There's still some elevation in Grand Ocean Advanced Resources' P/S, even if the same can't be said for its share price recently. We'd say the price-to-sales ratio's power isn't primarily as a valuation instrument but rather to gauge current investor sentiment and future expectations.
It's no surprise that Grand Ocean Advanced Resources can support its high P/S given the strong revenue growth its experienced over the last three-year is superior to the current industry outlook. Right now shareholders are comfortable with the P/S as they are quite confident revenue aren't under threat. Barring any significant changes to the company's ability to make money, the share price should continue to be propped up.
Having said that, be aware Grand Ocean Advanced Resources is showing 3 warning signs in our investment analysis, and 1 of those is a bit unpleasant.
If companies with solid past earnings growth is up your alley, you may wish to see this free collection of other companies with strong earnings growth and low P/E ratios.
New: Manage All Your Stock Portfolios in One Place
We've created the ultimate portfolio companion for stock investors, and it's free.
• Connect an unlimited number of Portfolios and see your total in one currency
• Be alerted to new Warning Signs or Risks via email or mobile
• Track the Fair Value of your stocks
Have feedback on this article? Concerned about the content? Get in touch with us directly. Alternatively, email editorial-team (at) simplywallst.com.
This article by Simply Wall St is general in nature. We provide commentary based on historical data and analyst forecasts only using an unbiased methodology and our articles are not intended to be financial advice. It does not constitute a recommendation to buy or sell any stock, and does not take account of your objectives, or your financial situation. We aim to bring you long-term focused analysis driven by fundamental data. Note that our analysis may not factor in the latest price-sensitive company announcements or qualitative material. Simply Wall St has no position in any stocks mentioned.
Have feedback on this article? Concerned about the content? Get in touch with us directly. Alternatively, email editorial-team@simplywallst.com
About SEHK:65
Grand Ocean Advanced Resources
An investment holding company, produces and sells coal and minerals in Hong Kong and the People’s Republic of China.
Adequate balance sheet with low risk.
Market Insights
Community Narratives


