- Hong Kong
- /
- Energy Services
- /
- SEHK:568
Shandong Molong Petroleum Machinery (HKG:568) Is Carrying A Fair Bit Of Debt


Howard Marks put it nicely when he said that, rather than worrying about share price volatility, 'The possibility of permanent loss is the risk I worry about... and every practical investor I know worries about.' It's only natural to consider a company's balance sheet when you examine how risky it is, since debt is often involved when a business collapses. As with many other companies Shandong Molong Petroleum Machinery Company Limited (HKG:568) makes use of debt. But the real question is whether this debt is making the company risky.
When Is Debt Dangerous?
Debt assists a business until the business has trouble paying it off, either with new capital or with free cash flow. Ultimately, if the company can't fulfill its legal obligations to repay debt, shareholders could walk away with nothing. However, a more usual (but still expensive) situation is where a company must dilute shareholders at a cheap share price simply to get debt under control. Having said that, the most common situation is where a company manages its debt reasonably well - and to its own advantage. The first step when considering a company's debt levels is to consider its cash and debt together.
Check out our latest analysis for Shandong Molong Petroleum Machinery
What Is Shandong Molong Petroleum Machinery's Net Debt?
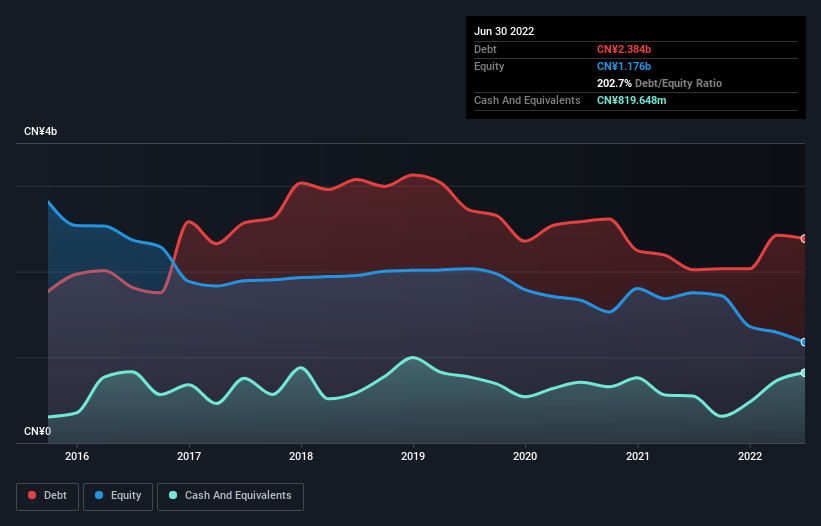
As you can see below, at the end of June 2022, Shandong Molong Petroleum Machinery had CN¥2.38b of debt, up from CN¥2.02b a year ago. Click the image for more detail. However, it does have CN¥819.6m in cash offsetting this, leading to net debt of about CN¥1.56b.
How Healthy Is Shandong Molong Petroleum Machinery's Balance Sheet?
We can see from the most recent balance sheet that Shandong Molong Petroleum Machinery had liabilities of CN¥3.83b falling due within a year, and liabilities of CN¥40.3m due beyond that. Offsetting this, it had CN¥819.6m in cash and CN¥637.8m in receivables that were due within 12 months. So it has liabilities totalling CN¥2.41b more than its cash and near-term receivables, combined.
This is a mountain of leverage relative to its market capitalization of CN¥3.71b. Should its lenders demand that it shore up the balance sheet, shareholders would likely face severe dilution. There's no doubt that we learn most about debt from the balance sheet. But it is Shandong Molong Petroleum Machinery's earnings that will influence how the balance sheet holds up in the future. So when considering debt, it's definitely worth looking at the earnings trend. Click here for an interactive snapshot.
Over 12 months, Shandong Molong Petroleum Machinery made a loss at the EBIT level, and saw its revenue drop to CN¥3.4b, which is a fall of 4.3%. That's not what we would hope to see.
Caveat Emptor
Over the last twelve months Shandong Molong Petroleum Machinery produced an earnings before interest and tax (EBIT) loss. To be specific the EBIT loss came in at CN¥300m. Considering that alongside the liabilities mentioned above does not give us much confidence that company should be using so much debt. So we think its balance sheet is a little strained, though not beyond repair. For example, we would not want to see a repeat of last year's loss of CN¥472m. So we do think this stock is quite risky. The balance sheet is clearly the area to focus on when you are analysing debt. However, not all investment risk resides within the balance sheet - far from it. For instance, we've identified 1 warning sign for Shandong Molong Petroleum Machinery that you should be aware of.
At the end of the day, it's often better to focus on companies that are free from net debt. You can access our special list of such companies (all with a track record of profit growth). It's free.
New: Manage All Your Stock Portfolios in One Place
We've created the ultimate portfolio companion for stock investors, and it's free.
• Connect an unlimited number of Portfolios and see your total in one currency
• Be alerted to new Warning Signs or Risks via email or mobile
• Track the Fair Value of your stocks
Have feedback on this article? Concerned about the content? Get in touch with us directly. Alternatively, email editorial-team (at) simplywallst.com.
This article by Simply Wall St is general in nature. We provide commentary based on historical data and analyst forecasts only using an unbiased methodology and our articles are not intended to be financial advice. It does not constitute a recommendation to buy or sell any stock, and does not take account of your objectives, or your financial situation. We aim to bring you long-term focused analysis driven by fundamental data. Note that our analysis may not factor in the latest price-sensitive company announcements or qualitative material. Simply Wall St has no position in any stocks mentioned.
About SEHK:568
Shandong Molong Petroleum Machinery
Engages in the design, research and development, production, and sale of products and services for the energy equipment industry in the People’s Republic of China and internationally.
Adequate balance sheet and fair value.
Market Insights

Community Narratives

