
Advertisement
- Hong Kong
- /
- Energy Services
- /
- SEHK:568
Here's Why Shandong Molong Petroleum Machinery (HKG:568) Can Afford Some Debt

Some say volatility, rather than debt, is the best way to think about risk as an investor, but Warren Buffett famously said that 'Volatility is far from synonymous with risk.' So it seems the smart money knows that debt - which is usually involved in bankruptcies - is a very important factor, when you assess how risky a company is. As with many other companies Shandong Molong Petroleum Machinery Company Limited (HKG:568) makes use of debt. But is this debt a concern to shareholders?
When Is Debt Dangerous?
Debt is a tool to help businesses grow, but if a business is incapable of paying off its lenders, then it exists at their mercy. Part and parcel of capitalism is the process of 'creative destruction' where failed businesses are mercilessly liquidated by their bankers. However, a more usual (but still expensive) situation is where a company must dilute shareholders at a cheap share price simply to get debt under control. By replacing dilution, though, debt can be an extremely good tool for businesses that need capital to invest in growth at high rates of return. When we examine debt levels, we first consider both cash and debt levels, together.
View our latest analysis for Shandong Molong Petroleum Machinery
How Much Debt Does Shandong Molong Petroleum Machinery Carry?
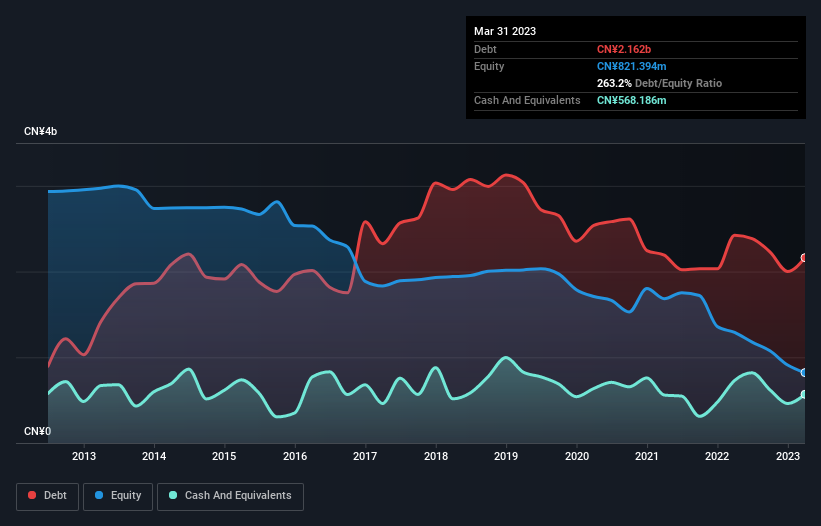
You can click the graphic below for the historical numbers, but it shows that Shandong Molong Petroleum Machinery had CN¥2.16b of debt in March 2023, down from CN¥2.42b, one year before. On the flip side, it has CN¥568.2m in cash leading to net debt of about CN¥1.59b.
How Strong Is Shandong Molong Petroleum Machinery's Balance Sheet?
Zooming in on the latest balance sheet data, we can see that Shandong Molong Petroleum Machinery had liabilities of CN¥3.02b due within 12 months and liabilities of CN¥137.2m due beyond that. Offsetting this, it had CN¥568.2m in cash and CN¥436.5m in receivables that were due within 12 months. So its liabilities total CN¥2.15b more than the combination of its cash and short-term receivables.
This is a mountain of leverage relative to its market capitalization of CN¥2.79b. Should its lenders demand that it shore up the balance sheet, shareholders would likely face severe dilution. There's no doubt that we learn most about debt from the balance sheet. But you can't view debt in total isolation; since Shandong Molong Petroleum Machinery will need earnings to service that debt. So when considering debt, it's definitely worth looking at the earnings trend. Click here for an interactive snapshot.
Over 12 months, Shandong Molong Petroleum Machinery made a loss at the EBIT level, and saw its revenue drop to CN¥2.6b, which is a fall of 30%. That makes us nervous, to say the least.
Caveat Emptor
Not only did Shandong Molong Petroleum Machinery's revenue slip over the last twelve months, but it also produced negative earnings before interest and tax (EBIT). Its EBIT loss was a whopping CN¥293m. Considering that alongside the liabilities mentioned above does not give us much confidence that company should be using so much debt. Quite frankly we think the balance sheet is far from match-fit, although it could be improved with time. For example, we would not want to see a repeat of last year's loss of CN¥445m. So we do think this stock is quite risky. When analysing debt levels, the balance sheet is the obvious place to start. But ultimately, every company can contain risks that exist outside of the balance sheet. Be aware that Shandong Molong Petroleum Machinery is showing 1 warning sign in our investment analysis , you should know about...
If, after all that, you're more interested in a fast growing company with a rock-solid balance sheet, then check out our list of net cash growth stocks without delay.
New: Manage All Your Stock Portfolios in One Place
We've created the ultimate portfolio companion for stock investors, and it's free.
• Connect an unlimited number of Portfolios and see your total in one currency
• Be alerted to new Warning Signs or Risks via email or mobile
• Track the Fair Value of your stocks
Have feedback on this article? Concerned about the content? Get in touch with us directly. Alternatively, email editorial-team (at) simplywallst.com.
This article by Simply Wall St is general in nature. We provide commentary based on historical data and analyst forecasts only using an unbiased methodology and our articles are not intended to be financial advice. It does not constitute a recommendation to buy or sell any stock, and does not take account of your objectives, or your financial situation. We aim to bring you long-term focused analysis driven by fundamental data. Note that our analysis may not factor in the latest price-sensitive company announcements or qualitative material. Simply Wall St has no position in any stocks mentioned.
About SEHK:568
Shandong Molong Petroleum Machinery
Engages in the design, research and development, production, and sale of products and services for the energy equipment industry in the People’s Republic of China and internationally.
Adequate balance sheet and fair value.
Market Insights

Advertisement
Community Narratives

BMW cruising ahead with new EVs and premium models to boost revenue 5%
Fair Value €135.07|44.5% undervalued
UN
Community Contributor
EU#2 - From Humble Beginnings to Global Powerhouse
Fair Value DKK 851.04|46.1% undervalued
TO
Community Contributor