
Advertisement

The external fund manager backed by Berkshire Hathaway's Charlie Munger, Li Lu, makes no bones about it when he says 'The biggest investment risk is not the volatility of prices, but whether you will suffer a permanent loss of capital.' So it might be obvious that you need to consider debt, when you think about how risky any given stock is, because too much debt can sink a company. We can see that JX Energy Ltd. (HKG:3395) does use debt in its business. But should shareholders be worried about its use of debt?
When Is Debt Dangerous?
Generally speaking, debt only becomes a real problem when a company can't easily pay it off, either by raising capital or with its own cash flow. Ultimately, if the company can't fulfill its legal obligations to repay debt, shareholders could walk away with nothing. However, a more common (but still painful) scenario is that it has to raise new equity capital at a low price, thus permanently diluting shareholders. Of course, plenty of companies use debt to fund growth, without any negative consequences. The first step when considering a company's debt levels is to consider its cash and debt together.
Check out our latest analysis for JX Energy
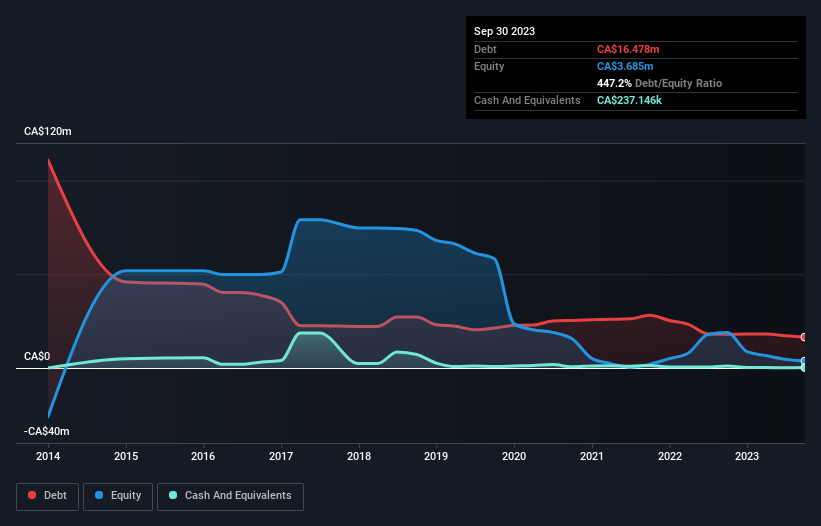
What Is JX Energy's Debt?
You can click the graphic below for the historical numbers, but it shows that JX Energy had CA$16.5m of debt in September 2023, down from CA$18.0m, one year before. Net debt is about the same, since the it doesn't have much cash.
A Look At JX Energy's Liabilities
The latest balance sheet data shows that JX Energy had liabilities of CA$14.1m due within a year, and liabilities of CA$29.5m falling due after that. Offsetting these obligations, it had cash of CA$237.1k as well as receivables valued at CA$1.22m due within 12 months. So it has liabilities totalling CA$42.1m more than its cash and near-term receivables, combined.
The deficiency here weighs heavily on the CA$19.0m company itself, as if a child were struggling under the weight of an enormous back-pack full of books, his sports gear, and a trumpet. So we'd watch its balance sheet closely, without a doubt. At the end of the day, JX Energy would probably need a major re-capitalization if its creditors were to demand repayment. The balance sheet is clearly the area to focus on when you are analysing debt. But it is JX Energy's earnings that will influence how the balance sheet holds up in the future. So if you're keen to discover more about its earnings, it might be worth checking out this graph of its long term earnings trend.
In the last year JX Energy had a loss before interest and tax, and actually shrunk its revenue by 33%, to CA$15m. That makes us nervous, to say the least.
Caveat Emptor
While JX Energy's falling revenue is about as heartwarming as a wet blanket, arguably its earnings before interest and tax (EBIT) loss is even less appealing. Indeed, it lost a very considerable CA$6.7m at the EBIT level. Considering that alongside the liabilities mentioned above make us nervous about the company. We'd want to see some strong near-term improvements before getting too interested in the stock. It's fair to say the loss of CA$17m didn't encourage us either; we'd like to see a profit. In the meantime, we consider the stock to be risky. When analysing debt levels, the balance sheet is the obvious place to start. However, not all investment risk resides within the balance sheet - far from it. For example, we've discovered 3 warning signs for JX Energy (1 is significant!) that you should be aware of before investing here.
If you're interested in investing in businesses that can grow profits without the burden of debt, then check out this free list of growing businesses that have net cash on the balance sheet.
New: Manage All Your Stock Portfolios in One Place
We've created the ultimate portfolio companion for stock investors, and it's free.
• Connect an unlimited number of Portfolios and see your total in one currency
• Be alerted to new Warning Signs or Risks via email or mobile
• Track the Fair Value of your stocks
Have feedback on this article? Concerned about the content? Get in touch with us directly. Alternatively, email editorial-team (at) simplywallst.com.
This article by Simply Wall St is general in nature. We provide commentary based on historical data and analyst forecasts only using an unbiased methodology and our articles are not intended to be financial advice. It does not constitute a recommendation to buy or sell any stock, and does not take account of your objectives, or your financial situation. We aim to bring you long-term focused analysis driven by fundamental data. Note that our analysis may not factor in the latest price-sensitive company announcements or qualitative material. Simply Wall St has no position in any stocks mentioned.
About SEHK:3395
JX Energy
Engages in the exploration and development of natural gas and crude oil in Alberta, Canada.
Slight with imperfect balance sheet.
Market Insights

Advertisement
Community Narratives

BMW cruising ahead with new EVs and premium models to boost revenue 5%
Fair Value €135.07|44.5% undervalued
UN
Community Contributor
EU#2 - From Humble Beginnings to Global Powerhouse
Fair Value DKK 851.04|46.1% undervalued
TO
Community Contributor