
Advertisement
- Hong Kong
- /
- Energy Services
- /
- SEHK:1938
Chu Kong Petroleum and Natural Gas Steel Pipe Holdings' (HKG:1938) Returns On Capital Are Heading Higher
There are a few key trends to look for if we want to identify the next multi-bagger. Firstly, we'd want to identify a growing return on capital employed (ROCE) and then alongside that, an ever-increasing base of capital employed. If you see this, it typically means it's a company with a great business model and plenty of profitable reinvestment opportunities. So when we looked at Chu Kong Petroleum and Natural Gas Steel Pipe Holdings (HKG:1938) and its trend of ROCE, we really liked what we saw.
Understanding Return On Capital Employed (ROCE)
If you haven't worked with ROCE before, it measures the 'return' (pre-tax profit) a company generates from capital employed in its business. The formula for this calculation on Chu Kong Petroleum and Natural Gas Steel Pipe Holdings is:
Return on Capital Employed = Earnings Before Interest and Tax (EBIT) ÷ (Total Assets - Current Liabilities)
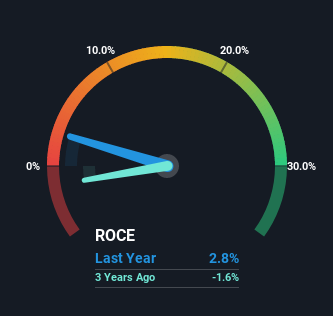
0.028 = CN¥92m ÷ (CN¥7.4b - CN¥4.2b) (Based on the trailing twelve months to June 2022).
Thus, Chu Kong Petroleum and Natural Gas Steel Pipe Holdings has an ROCE of 2.8%. In absolute terms, that's a low return and it also under-performs the Energy Services industry average of 6.8%.
See our latest analysis for Chu Kong Petroleum and Natural Gas Steel Pipe Holdings
While the past is not representative of the future, it can be helpful to know how a company has performed historically, which is why we have this chart above. If you're interested in investigating Chu Kong Petroleum and Natural Gas Steel Pipe Holdings' past further, check out this free graph of past earnings, revenue and cash flow.
What Does the ROCE Trend For Chu Kong Petroleum and Natural Gas Steel Pipe Holdings Tell Us?
It's great to see that Chu Kong Petroleum and Natural Gas Steel Pipe Holdings has started to generate some pre-tax earnings from prior investments. Historically the company was generating losses but as we can see from the latest figures referenced above, they're now earning 2.8% on their capital employed. In regards to capital employed, Chu Kong Petroleum and Natural Gas Steel Pipe Holdings is using 35% less capital than it was five years ago, which on the surface, can indicate that the business has become more efficient at generating these returns. Chu Kong Petroleum and Natural Gas Steel Pipe Holdings could be selling under-performing assets since the ROCE is improving.
On a side note, Chu Kong Petroleum and Natural Gas Steel Pipe Holdings' current liabilities are still rather high at 56% of total assets. This effectively means that suppliers (or short-term creditors) are funding a large portion of the business, so just be aware that this can introduce some elements of risk. While it's not necessarily a bad thing, it can be beneficial if this ratio is lower.
In Conclusion...
In summary, it's great to see that Chu Kong Petroleum and Natural Gas Steel Pipe Holdings has been able to turn things around and earn higher returns on lower amounts of capital. And since the stock has dived 79% over the last five years, there may be other factors affecting the company's prospects. Still, it's worth doing some further research to see if the trends will continue into the future.
Chu Kong Petroleum and Natural Gas Steel Pipe Holdings does have some risks, we noticed 4 warning signs (and 1 which is a bit unpleasant) we think you should know about.
For those who like to invest in solid companies, check out this free list of companies with solid balance sheets and high returns on equity.
New: AI Stock Screener & Alerts
Our new AI Stock Screener scans the market every day to uncover opportunities.
• Dividend Powerhouses (3%+ Yield)
• Undervalued Small Caps with Insider Buying
• High growth Tech and AI Companies
Or build your own from over 50 metrics.
Have feedback on this article? Concerned about the content? Get in touch with us directly. Alternatively, email editorial-team (at) simplywallst.com.
This article by Simply Wall St is general in nature. We provide commentary based on historical data and analyst forecasts only using an unbiased methodology and our articles are not intended to be financial advice. It does not constitute a recommendation to buy or sell any stock, and does not take account of your objectives, or your financial situation. We aim to bring you long-term focused analysis driven by fundamental data. Note that our analysis may not factor in the latest price-sensitive company announcements or qualitative material. Simply Wall St has no position in any stocks mentioned.
About SEHK:1938
Chu Kong Petroleum and Natural Gas Steel Pipe Holdings
An investment holding company, manufactures and sells longitudinal welded steel pipes in Mainland China, Africa, Europe, the Middle East, rest of Asia, South America, and North America.
Good value with proven track record.
Market Insights

Advertisement
Community Narratives
MicroVision will explode future revenue by 380.37% with a vision towards success
Fair Value US$60|98.4% undervalued
TH
Community Contributor
The Indispensable Artery for a New North American Economy
Fair Value CA$132.87|0.6% undervalued
TI
Community Contributor
Recently Updated Narratives
MA


MarkoVT on COVER ·
Q3 Outlook modestly optimistic
Fair Value:JP¥1.65k2.0% overvalued
1 followerusers have followed this narrative
0 commentsusers have commented on this narrative
0 likesusers have liked this narrative
BL


BlackGoat on Alphabet ·
Alphabet: The Under-appreciated Compounder Hiding in Plain Sight
Fair Value:US$324.481.3% undervalued
76 followersusers have followed this narrative
3 commentsusers have commented on this narrative
1 likeusers have liked this narrative
BE


Bejgal on MINISO Group Holding ·
MINISO's fair value is projected at 26.69 with an anticipated PE ratio shift of 20x
Fair Value:US$26.6926.7% undervalued
46 followersusers have followed this narrative
3 commentsusers have commented on this narrative
0 likesusers have liked this narrative
Popular Narratives
OS

oscargarcia on Alphabet ·
The company that turned a verb into a global necessity and basically runs the modern internet, digital ads, smartphones, maps, and AI.
Fair Value:US$3405.9% undervalued
136 followersusers have followed this narrative
6 commentsusers have commented on this narrative
18 likesusers have liked this narrative
TH

TheWallstreetKing on MicroVision ·
MicroVision will explode future revenue by 380.37% with a vision towards success
Fair Value:US$6098.4% undervalued
90 followersusers have followed this narrative
10 commentsusers have commented on this narrative
18 likesusers have liked this narrative
AN


AnalystConsensusTarget on NVIDIA ·
NVDA: Expanding AI Demand Will Drive Major Data Center Investments Through 2026
Fair Value:US$232.7922.6% undervalued
928 followersusers have followed this narrative
6 commentsusers have commented on this narrative
22 likesusers have liked this narrative