- Hong Kong
- /
- Oil and Gas
- /
- SEHK:1229
Calculating The Intrinsic Value Of Nan Nan Resources Enterprise Limited (HKG:1229)

Key Insights
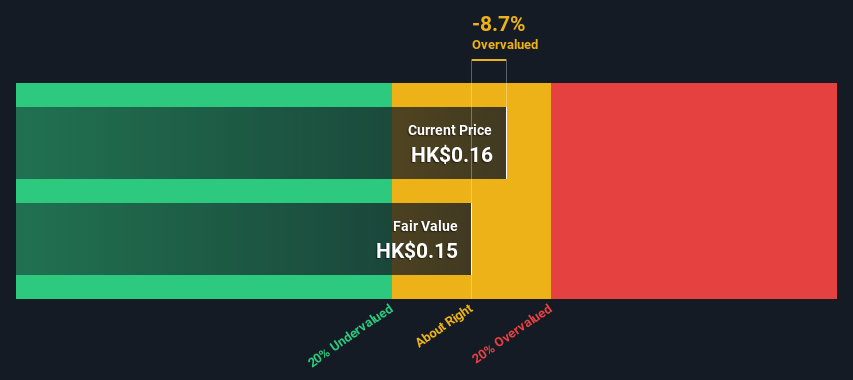
- The projected fair value for Nan Nan Resources Enterprise is HK$0.15 based on 2 Stage Free Cash Flow to Equity
- Nan Nan Resources Enterprise's HK$0.16 share price indicates it is trading at similar levels as its fair value estimate
- Peers of Nan Nan Resources Enterprise are currently trading on average at a 12% discount
Today we will run through one way of estimating the intrinsic value of Nan Nan Resources Enterprise Limited (HKG:1229) by projecting its future cash flows and then discounting them to today's value. We will use the Discounted Cash Flow (DCF) model on this occasion. There's really not all that much to it, even though it might appear quite complex.
We would caution that there are many ways of valuing a company and, like the DCF, each technique has advantages and disadvantages in certain scenarios. If you want to learn more about discounted cash flow, the rationale behind this calculation can be read in detail in the Simply Wall St analysis model.
View our latest analysis for Nan Nan Resources Enterprise
Is Nan Nan Resources Enterprise Fairly Valued?
We use what is known as a 2-stage model, which simply means we have two different periods of growth rates for the company's cash flows. Generally the first stage is higher growth, and the second stage is a lower growth phase. To start off with, we need to estimate the next ten years of cash flows. Seeing as no analyst estimates of free cash flow are available to us, we have extrapolate the previous free cash flow (FCF) from the company's last reported value. We assume companies with shrinking free cash flow will slow their rate of shrinkage, and that companies with growing free cash flow will see their growth rate slow, over this period. We do this to reflect that growth tends to slow more in the early years than it does in later years.
Generally we assume that a dollar today is more valuable than a dollar in the future, so we need to discount the sum of these future cash flows to arrive at a present value estimate:
10-year free cash flow (FCF) forecast
| 2023 | 2024 | 2025 | 2026 | 2027 | 2028 | 2029 | 2030 | 2031 | 2032 | |
| Levered FCF (HK$, Millions) | HK$17.7m | HK$17.2m | HK$17.0m | HK$16.9m | HK$16.9m | HK$17.1m | HK$17.2m | HK$17.5m | HK$17.7m | HK$18.0m |
| Growth Rate Estimate Source | Est @ -4.65% | Est @ -2.71% | Est @ -1.36% | Est @ -0.41% | Est @ 0.25% | Est @ 0.72% | Est @ 1.04% | Est @ 1.27% | Est @ 1.43% | Est @ 1.54% |
| Present Value (HK$, Millions) Discounted @ 16% | HK$15.3 | HK$12.8 | HK$10.9 | HK$9.4 | HK$8.2 | HK$7.1 | HK$6.2 | HK$5.4 | HK$4.8 | HK$4.2 |
("Est" = FCF growth rate estimated by Simply Wall St)
Present Value of 10-year Cash Flow (PVCF) = HK$84m
After calculating the present value of future cash flows in the initial 10-year period, we need to calculate the Terminal Value, which accounts for all future cash flows beyond the first stage. The Gordon Growth formula is used to calculate Terminal Value at a future annual growth rate equal to the 5-year average of the 10-year government bond yield of 1.8%. We discount the terminal cash flows to today's value at a cost of equity of 16%.
Terminal Value (TV)= FCF2032 × (1 + g) ÷ (r – g) = HK$18m× (1 + 1.8%) ÷ (16%– 1.8%) = HK$131m
Present Value of Terminal Value (PVTV)= TV / (1 + r)10= HK$131m÷ ( 1 + 16%)10= HK$30m
The total value, or equity value, is then the sum of the present value of the future cash flows, which in this case is HK$115m. The last step is to then divide the equity value by the number of shares outstanding. Compared to the current share price of HK$0.2, the company appears around fair value at the time of writing. Valuations are imprecise instruments though, rather like a telescope - move a few degrees and end up in a different galaxy. Do keep this in mind.
The Assumptions
The calculation above is very dependent on two assumptions. The first is the discount rate and the other is the cash flows. You don't have to agree with these inputs, I recommend redoing the calculations yourself and playing with them. The DCF also does not consider the possible cyclicality of an industry, or a company's future capital requirements, so it does not give a full picture of a company's potential performance. Given that we are looking at Nan Nan Resources Enterprise as potential shareholders, the cost of equity is used as the discount rate, rather than the cost of capital (or weighted average cost of capital, WACC) which accounts for debt. In this calculation we've used 16%, which is based on a levered beta of 2.000. Beta is a measure of a stock's volatility, compared to the market as a whole. We get our beta from the industry average beta of globally comparable companies, with an imposed limit between 0.8 and 2.0, which is a reasonable range for a stable business.
SWOT Analysis for Nan Nan Resources Enterprise
- Debt is well covered by earnings and cashflows.
- Current share price is above our estimate of fair value.
- Has sufficient cash runway for more than 3 years based on current free cash flows.
- Lack of analyst coverage makes it difficult to determine 1229's earnings prospects.
- Total liabilities exceed total assets, which raises the risk of financial distress.
Next Steps:
Although the valuation of a company is important, it shouldn't be the only metric you look at when researching a company. It's not possible to obtain a foolproof valuation with a DCF model. Instead the best use for a DCF model is to test certain assumptions and theories to see if they would lead to the company being undervalued or overvalued. If a company grows at a different rate, or if its cost of equity or risk free rate changes sharply, the output can look very different. For Nan Nan Resources Enterprise, there are three essential aspects you should further examine:
- Risks: Take risks, for example - Nan Nan Resources Enterprise has 4 warning signs (and 2 which can't be ignored) we think you should know about.
- Other Solid Businesses: Low debt, high returns on equity and good past performance are fundamental to a strong business. Why not explore our interactive list of stocks with solid business fundamentals to see if there are other companies you may not have considered!
- Other Top Analyst Picks: Interested to see what the analysts are thinking? Take a look at our interactive list of analysts' top stock picks to find out what they feel might have an attractive future outlook!
PS. Simply Wall St updates its DCF calculation for every Hong Kong stock every day, so if you want to find the intrinsic value of any other stock just search here.
Mobile Infrastructure for Defense and Disaster
The next wave in robotics isn't humanoid. Its fully autonomous towers delivering 5G, ISR, and radar in under 30 minutes, anywhere.
Get the investor briefing before the next round of contracts
Sponsored On Behalf of CiTechValuation is complex, but we're here to simplify it.
Discover if Nan Nan Resources Enterprise might be undervalued or overvalued with our detailed analysis, featuring fair value estimates, potential risks, dividends, insider trades, and its financial condition.
Access Free AnalysisHave feedback on this article? Concerned about the content? Get in touch with us directly. Alternatively, email editorial-team (at) simplywallst.com.
This article by Simply Wall St is general in nature. We provide commentary based on historical data and analyst forecasts only using an unbiased methodology and our articles are not intended to be financial advice. It does not constitute a recommendation to buy or sell any stock, and does not take account of your objectives, or your financial situation. We aim to bring you long-term focused analysis driven by fundamental data. Note that our analysis may not factor in the latest price-sensitive company announcements or qualitative material. Simply Wall St has no position in any stocks mentioned.
About SEHK:1229
Nan Nan Resources Enterprise
An investment holding company, engages in the mining and sale of coal in the Mainland China, Hong Kong, Singapore, the United Kingdom, and Malaysia.
Excellent balance sheet and slightly overvalued.
Market Insights

Weekly Picks

Early mover in a fast growing industry. Likely to experience share price volatility as they scale


A case for CA$31.80 (undiluted), aka 8,616% upside from CA$0.37 (an 86 bagger!).


Moderation and Stabilisation: HOLD: Fair Price based on a 4-year Cycle is $12.08
Recently Updated Narratives


An amazing opportunity to potentially get a 100 bagger

Amazon: Why the World’s Biggest Platform Still Runs on Invisible Economics

Sunrun Stock: When the Energy Transition Collides With the Cost of Capital
Popular Narratives


MicroVision will explode future revenue by 380.37% with a vision towards success


Crazy Undervalued 42 Baggers Silver Play (Active & Running Mine)

