- Hong Kong
- /
- Energy Services
- /
- SEHK:1080
Shengli Oil & Gas Pipe Holdings Limited's (HKG:1080) Popularity With Investors Under Threat As Stock Sinks 31%


Unfortunately for some shareholders, the Shengli Oil & Gas Pipe Holdings Limited (HKG:1080) share price has dived 31% in the last thirty days, prolonging recent pain. The recent drop completes a disastrous twelve months for shareholders, who are sitting on a 64% loss during that time.
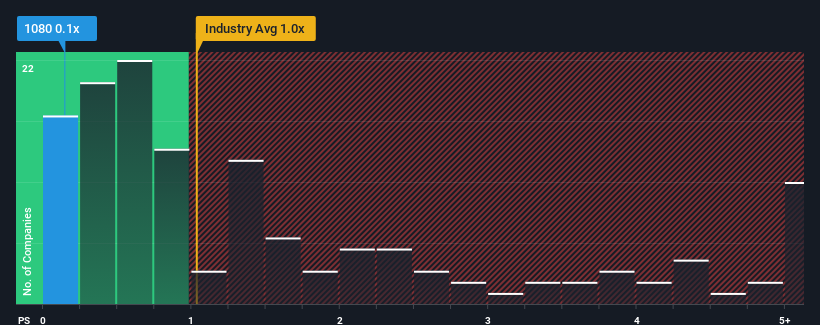
Although its price has dipped substantially, it's still not a stretch to say that Shengli Oil & Gas Pipe Holdings' price-to-sales (or "P/S") ratio of 0.1x right now seems quite "middle-of-the-road" compared to the Energy Services industry in Hong Kong, where the median P/S ratio is around 0.4x. However, investors might be overlooking a clear opportunity or potential setback if there is no rational basis for the P/S.
See our latest analysis for Shengli Oil & Gas Pipe Holdings
How Has Shengli Oil & Gas Pipe Holdings Performed Recently?
As an illustration, revenue has deteriorated at Shengli Oil & Gas Pipe Holdings over the last year, which is not ideal at all. Perhaps investors believe the recent revenue performance is enough to keep in line with the industry, which is keeping the P/S from dropping off. If not, then existing shareholders may be a little nervous about the viability of the share price.
Want the full picture on earnings, revenue and cash flow for the company? Then our free report on Shengli Oil & Gas Pipe Holdings will help you shine a light on its historical performance.What Are Revenue Growth Metrics Telling Us About The P/S?
Shengli Oil & Gas Pipe Holdings' P/S ratio would be typical for a company that's only expected to deliver moderate growth, and importantly, perform in line with the industry.
Retrospectively, the last year delivered a frustrating 43% decrease to the company's top line. As a result, revenue from three years ago have also fallen 31% overall. So unfortunately, we have to acknowledge that the company has not done a great job of growing revenue over that time.
Weighing that medium-term revenue trajectory against the broader industry's one-year forecast for expansion of 14% shows it's an unpleasant look.
With this in mind, we find it worrying that Shengli Oil & Gas Pipe Holdings' P/S exceeds that of its industry peers. It seems most investors are ignoring the recent poor growth rate and are hoping for a turnaround in the company's business prospects. Only the boldest would assume these prices are sustainable as a continuation of recent revenue trends is likely to weigh on the share price eventually.
The Bottom Line On Shengli Oil & Gas Pipe Holdings' P/S
Shengli Oil & Gas Pipe Holdings' plummeting stock price has brought its P/S back to a similar region as the rest of the industry. It's argued the price-to-sales ratio is an inferior measure of value within certain industries, but it can be a powerful business sentiment indicator.
The fact that Shengli Oil & Gas Pipe Holdings currently trades at a P/S on par with the rest of the industry is surprising to us since its recent revenues have been in decline over the medium-term, all while the industry is set to grow. Even though it matches the industry, we're uncomfortable with the current P/S ratio, as this dismal revenue performance is unlikely to support a more positive sentiment for long. Unless the the circumstances surrounding the recent medium-term improve, it wouldn't be wrong to expect a a difficult period ahead for the company's shareholders.
It's always necessary to consider the ever-present spectre of investment risk. We've identified 3 warning signs with Shengli Oil & Gas Pipe Holdings (at least 1 which is a bit unpleasant), and understanding these should be part of your investment process.
If you're unsure about the strength of Shengli Oil & Gas Pipe Holdings' business, why not explore our interactive list of stocks with solid business fundamentals for some other companies you may have missed.
New: Manage All Your Stock Portfolios in One Place
We've created the ultimate portfolio companion for stock investors, and it's free.
• Connect an unlimited number of Portfolios and see your total in one currency
• Be alerted to new Warning Signs or Risks via email or mobile
• Track the Fair Value of your stocks
Have feedback on this article? Concerned about the content? Get in touch with us directly. Alternatively, email editorial-team (at) simplywallst.com.
This article by Simply Wall St is general in nature. We provide commentary based on historical data and analyst forecasts only using an unbiased methodology and our articles are not intended to be financial advice. It does not constitute a recommendation to buy or sell any stock, and does not take account of your objectives, or your financial situation. We aim to bring you long-term focused analysis driven by fundamental data. Note that our analysis may not factor in the latest price-sensitive company announcements or qualitative material. Simply Wall St has no position in any stocks mentioned.
Have feedback on this article? Concerned about the content? Get in touch with us directly. Alternatively, email editorial-team@simplywallst.com
About SEHK:1080
Shengli Oil & Gas Pipe Holdings
An investment holding company, engages in the design, process, manufacture, and sale of welded pipes for oil and gas pipeline in Mainland China.
Adequate balance sheet very low.

