
Advertisement
- Hong Kong
- /
- Capital Markets
- /
- SEHK:863
With A 39% Price Drop For OSL Group Limited (HKG:863) You'll Still Get What You Pay For
OSL Group Limited (HKG:863) shares have had a horrible month, losing 39% after a relatively good period beforehand. The good news is that in the last year, the stock has shone bright like a diamond, gaining 163%.
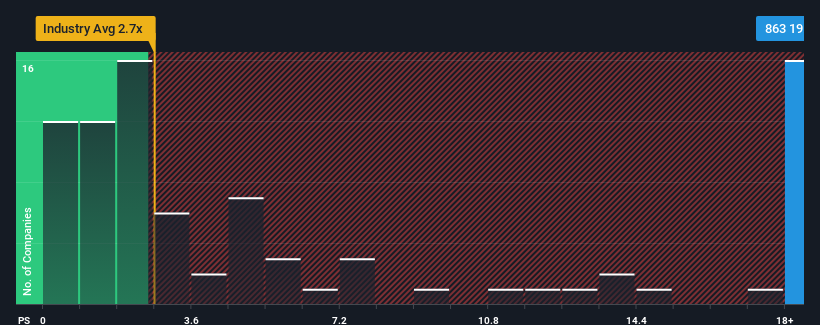
In spite of the heavy fall in price, you could still be forgiven for thinking OSL Group is a stock to steer clear of with a price-to-sales ratios (or "P/S") of 19.8x, considering almost half the companies in Hong Kong's Capital Markets industry have P/S ratios below 2.7x. Although, it's not wise to just take the P/S at face value as there may be an explanation why it's so lofty.
Check out our latest analysis for OSL Group
What Does OSL Group's Recent Performance Look Like?
OSL Group certainly has been doing a good job lately as its revenue growth has been positive while most other companies have been seeing their revenue go backwards. Perhaps the market is expecting the company's future revenue growth to buck the trend of the industry, contributing to a higher P/S. However, if this isn't the case, investors might get caught out paying too much for the stock.
Want the full picture on analyst estimates for the company? Then our free report on OSL Group will help you uncover what's on the horizon.How Is OSL Group's Revenue Growth Trending?
In order to justify its P/S ratio, OSL Group would need to produce outstanding growth that's well in excess of the industry.
If we review the last year of revenue growth, the company posted a terrific increase of 194%. Despite this strong recent growth, it's still struggling to catch up as its three-year revenue frustratingly shrank by 14% overall. Accordingly, shareholders would have felt downbeat about the medium-term rates of revenue growth.
Shifting to the future, estimates from the lone analyst covering the company suggest revenue should grow by 67% over the next year. That's shaping up to be materially higher than the 38% growth forecast for the broader industry.
With this information, we can see why OSL Group is trading at such a high P/S compared to the industry. Apparently shareholders aren't keen to offload something that is potentially eyeing a more prosperous future.
The Key Takeaway
A significant share price dive has done very little to deflate OSL Group's very lofty P/S. Generally, our preference is to limit the use of the price-to-sales ratio to establishing what the market thinks about the overall health of a company.
Our look into OSL Group shows that its P/S ratio remains high on the merit of its strong future revenues. Right now shareholders are comfortable with the P/S as they are quite confident future revenues aren't under threat. It's hard to see the share price falling strongly in the near future under these circumstances.
Don't forget that there may be other risks. For instance, we've identified 4 warning signs for OSL Group that you should be aware of.
If companies with solid past earnings growth is up your alley, you may wish to see this free collection of other companies with strong earnings growth and low P/E ratios.
New: AI Stock Screener & Alerts
Our new AI Stock Screener scans the market every day to uncover opportunities.
• Dividend Powerhouses (3%+ Yield)
• Undervalued Small Caps with Insider Buying
• High growth Tech and AI Companies
Or build your own from over 50 metrics.
Have feedback on this article? Concerned about the content? Get in touch with us directly. Alternatively, email editorial-team (at) simplywallst.com.
This article by Simply Wall St is general in nature. We provide commentary based on historical data and analyst forecasts only using an unbiased methodology and our articles are not intended to be financial advice. It does not constitute a recommendation to buy or sell any stock, and does not take account of your objectives, or your financial situation. We aim to bring you long-term focused analysis driven by fundamental data. Note that our analysis may not factor in the latest price-sensitive company announcements or qualitative material. Simply Wall St has no position in any stocks mentioned.
About SEHK:863
OSL Group
An investment holding company, engages in digital assets and blockchain platform business in Hong Kong, Australia, Japan, Singapore, and Mainland China.
High growth potential with adequate balance sheet.
Market Insights

Advertisement
Community Narratives
MicroVision will explode future revenue by 380.37% with a vision towards success
Fair Value US$60|98.4% undervalued
TH
Community Contributor
The Indispensable Artery for a New North American Economy
Fair Value CA$132.87|0.7% overvalued
TI
Community Contributor
Recently Updated Narratives
BE


Bejgal on MINISO Group Holding ·
MINISO's fair value is projected at 26.69 with an anticipated PE ratio shift of 20x
Fair Value:US$28.1829.5% undervalued
46 followersusers have followed this narrative
3 commentsusers have commented on this narrative
0 likesusers have liked this narrative
BE

Bejgal on Fiverr International ·
Fiverr International will transform the freelance industry with AI-powered growth
Fair Value:US$36.8143.1% undervalued
79 followersusers have followed this narrative
7 commentsusers have commented on this narrative
0 likesusers have liked this narrative
CE

cementafriend on Constellation Energy ·
Constellation Energy Dividends and Growth
Fair Value:US$348.054.7% overvalued
2 followersusers have followed this narrative
0 commentsusers have commented on this narrative
0 likesusers have liked this narrative
Popular Narratives
TH

TheWallstreetKing on MicroVision ·
MicroVision will explode future revenue by 380.37% with a vision towards success
Fair Value:US$6098.4% undervalued
109 followersusers have followed this narrative
10 commentsusers have commented on this narrative
21 likesusers have liked this narrative
AN


AnalystConsensusTarget on NVIDIA ·
NVDA: Expanding AI Demand Will Drive Major Data Center Investments Through 2026
Fair Value:US$250.3929.3% undervalued
937 followersusers have followed this narrative
6 commentsusers have commented on this narrative
24 likesusers have liked this narrative
OS


oscargarcia on Alphabet ·
The company that turned a verb into a global necessity and basically runs the modern internet, digital ads, smartphones, maps, and AI.
Fair Value:US$3405.8% undervalued
145 followersusers have followed this narrative
6 commentsusers have commented on this narrative
18 likesusers have liked this narrative