
Advertisement
- Hong Kong
- /
- Diversified Financial
- /
- SEHK:8223
Risks Still Elevated At These Prices As Ziyuanyuan Holdings Group Limited (HKG:8223) Shares Dive 31%
Ziyuanyuan Holdings Group Limited (HKG:8223) shareholders won't be pleased to see that the share price has had a very rough month, dropping 31% and undoing the prior period's positive performance. Looking at the bigger picture, even after this poor month the stock is up 35% in the last year.
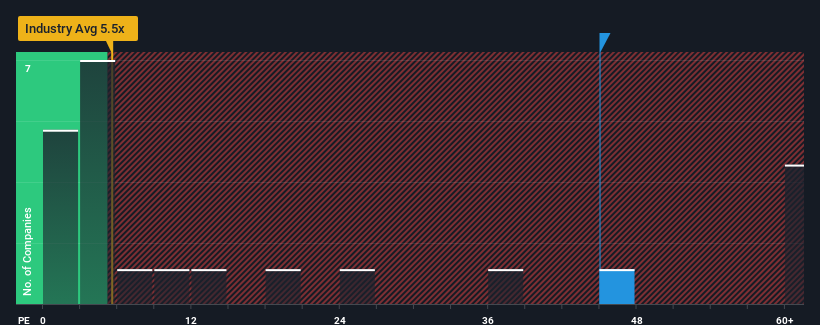
Although its price has dipped substantially, Ziyuanyuan Holdings Group's price-to-earnings (or "P/E") ratio of 45x might still make it look like a strong sell right now compared to the market in Hong Kong, where around half of the companies have P/E ratios below 8x and even P/E's below 5x are quite common. Nonetheless, we'd need to dig a little deeper to determine if there is a rational basis for the highly elevated P/E.
For instance, Ziyuanyuan Holdings Group's receding earnings in recent times would have to be some food for thought. One possibility is that the P/E is high because investors think the company will still do enough to outperform the broader market in the near future. You'd really hope so, otherwise you're paying a pretty hefty price for no particular reason.
Check out our latest analysis for Ziyuanyuan Holdings Group
Is There Enough Growth For Ziyuanyuan Holdings Group?
In order to justify its P/E ratio, Ziyuanyuan Holdings Group would need to produce outstanding growth well in excess of the market.
If we review the last year of earnings, dishearteningly the company's profits fell to the tune of 7.9%. Unfortunately, that's brought it right back to where it started three years ago with EPS growth being virtually non-existent overall during that time. Therefore, it's fair to say that earnings growth has been inconsistent recently for the company.
Weighing that recent medium-term earnings trajectory against the broader market's one-year forecast for expansion of 21% shows it's noticeably less attractive on an annualised basis.
With this information, we find it concerning that Ziyuanyuan Holdings Group is trading at a P/E higher than the market. Apparently many investors in the company are way more bullish than recent times would indicate and aren't willing to let go of their stock at any price. Only the boldest would assume these prices are sustainable as a continuation of recent earnings trends is likely to weigh heavily on the share price eventually.
The Final Word
Even after such a strong price drop, Ziyuanyuan Holdings Group's P/E still exceeds the rest of the market significantly. Using the price-to-earnings ratio alone to determine if you should sell your stock isn't sensible, however it can be a practical guide to the company's future prospects.
We've established that Ziyuanyuan Holdings Group currently trades on a much higher than expected P/E since its recent three-year growth is lower than the wider market forecast. Right now we are increasingly uncomfortable with the high P/E as this earnings performance isn't likely to support such positive sentiment for long. If recent medium-term earnings trends continue, it will place shareholders' investments at significant risk and potential investors in danger of paying an excessive premium.
We don't want to rain on the parade too much, but we did also find 5 warning signs for Ziyuanyuan Holdings Group (1 is significant!) that you need to be mindful of.
Of course, you might also be able to find a better stock than Ziyuanyuan Holdings Group. So you may wish to see this free collection of other companies that have reasonable P/E ratios and have grown earnings strongly.
Valuation is complex, but we're here to simplify it.
Discover if Ziyuanyuan Holdings Group might be undervalued or overvalued with our detailed analysis, featuring fair value estimates, potential risks, dividends, insider trades, and its financial condition.
Access Free AnalysisHave feedback on this article? Concerned about the content? Get in touch with us directly. Alternatively, email editorial-team (at) simplywallst.com.
This article by Simply Wall St is general in nature. We provide commentary based on historical data and analyst forecasts only using an unbiased methodology and our articles are not intended to be financial advice. It does not constitute a recommendation to buy or sell any stock, and does not take account of your objectives, or your financial situation. We aim to bring you long-term focused analysis driven by fundamental data. Note that our analysis may not factor in the latest price-sensitive company announcements or qualitative material. Simply Wall St has no position in any stocks mentioned.
About SEHK:8223
Ziyuanyuan Holdings Group
An investment holding company, provides medical equipment finance leasing services in the People's Republic of China.
Moderate risk and slightly overvalued.
Market Insights

Advertisement
Community Narratives
Quality at a Premium. A time to watch, not to buy?
Fair Value US$154.56|30.1% undervalued
DA
Community Contributor
GRAB: The Super-App at the Heart of Southeast Asia’s Digital Boom
Fair Value US$8.20|25.6% undervalued
BL
Community Contributor
Verve Group to Surge with 51.61% Revenue Growth
Fair Value €6.00|63.2% undervalued
ME
Community Contributor