
Advertisement
- Hong Kong
- /
- Capital Markets
- /
- SEHK:806
With A 25% Price Drop For Value Partners Group Limited (HKG:806) You'll Still Get What You Pay For
Value Partners Group Limited (HKG:806) shares have had a horrible month, losing 25% after a relatively good period beforehand. The drop over the last 30 days has capped off a tough year for shareholders, with the share price down 27% in that time.
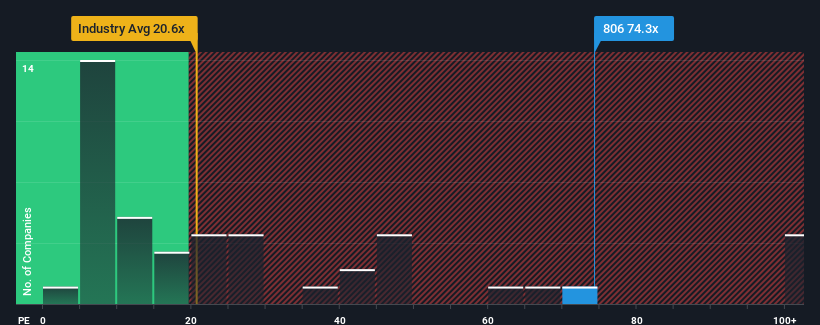
Even after such a large drop in price, Value Partners Group may still be sending very bearish signals at the moment with a price-to-earnings (or "P/E") ratio of 74.3x, since almost half of all companies in Hong Kong have P/E ratios under 9x and even P/E's lower than 5x are not unusual. However, the P/E might be quite high for a reason and it requires further investigation to determine if it's justified.
Value Partners Group certainly has been doing a good job lately as it's been growing earnings more than most other companies. The P/E is probably high because investors think this strong earnings performance will continue. If not, then existing shareholders might be a little nervous about the viability of the share price.
See our latest analysis for Value Partners Group
How Is Value Partners Group's Growth Trending?
Value Partners Group's P/E ratio would be typical for a company that's expected to deliver very strong growth, and importantly, perform much better than the market.
Taking a look back first, we see that the company grew earnings per share by an impressive 35% last year. Still, incredibly EPS has fallen 93% in total from three years ago, which is quite disappointing. Therefore, it's fair to say the earnings growth recently has been undesirable for the company.
Looking ahead now, EPS is anticipated to climb by 130% each year during the coming three years according to the only analyst following the company. That's shaping up to be materially higher than the 14% per year growth forecast for the broader market.
In light of this, it's understandable that Value Partners Group's P/E sits above the majority of other companies. It seems most investors are expecting this strong future growth and are willing to pay more for the stock.
What We Can Learn From Value Partners Group's P/E?
Value Partners Group's shares may have retreated, but its P/E is still flying high. Typically, we'd caution against reading too much into price-to-earnings ratios when settling on investment decisions, though it can reveal plenty about what other market participants think about the company.
We've established that Value Partners Group maintains its high P/E on the strength of its forecast growth being higher than the wider market, as expected. Right now shareholders are comfortable with the P/E as they are quite confident future earnings aren't under threat. Unless these conditions change, they will continue to provide strong support to the share price.
And what about other risks? Every company has them, and we've spotted 1 warning sign for Value Partners Group you should know about.
If you're unsure about the strength of Value Partners Group's business, why not explore our interactive list of stocks with solid business fundamentals for some other companies you may have missed.
New: Manage All Your Stock Portfolios in One Place
We've created the ultimate portfolio companion for stock investors, and it's free.
• Connect an unlimited number of Portfolios and see your total in one currency
• Be alerted to new Warning Signs or Risks via email or mobile
• Track the Fair Value of your stocks
Have feedback on this article? Concerned about the content? Get in touch with us directly. Alternatively, email editorial-team (at) simplywallst.com.
This article by Simply Wall St is general in nature. We provide commentary based on historical data and analyst forecasts only using an unbiased methodology and our articles are not intended to be financial advice. It does not constitute a recommendation to buy or sell any stock, and does not take account of your objectives, or your financial situation. We aim to bring you long-term focused analysis driven by fundamental data. Note that our analysis may not factor in the latest price-sensitive company announcements or qualitative material. Simply Wall St has no position in any stocks mentioned.
About SEHK:806
Adequate balance sheet with moderate growth potential.
Market Insights

Advertisement
Community Narratives
Finding The True Value Of A Logistics Powerhouse
Fair Value US$95.21|8.7% undervalued
NV
Community Contributor
Paradigm Biopharmaceuticals Will Lead Osteoarthritis Treatment with Zilosul's FDA Success
Fair Value AU$5.50|93.3% undervalued
AM
Community Contributor
Barrick Mining (ABX:CA): A Gold Hedge against a U.S. Shutdown
Fair Value CA$60.00|18.7% undervalued
GM
Community Contributor